Quick Tour
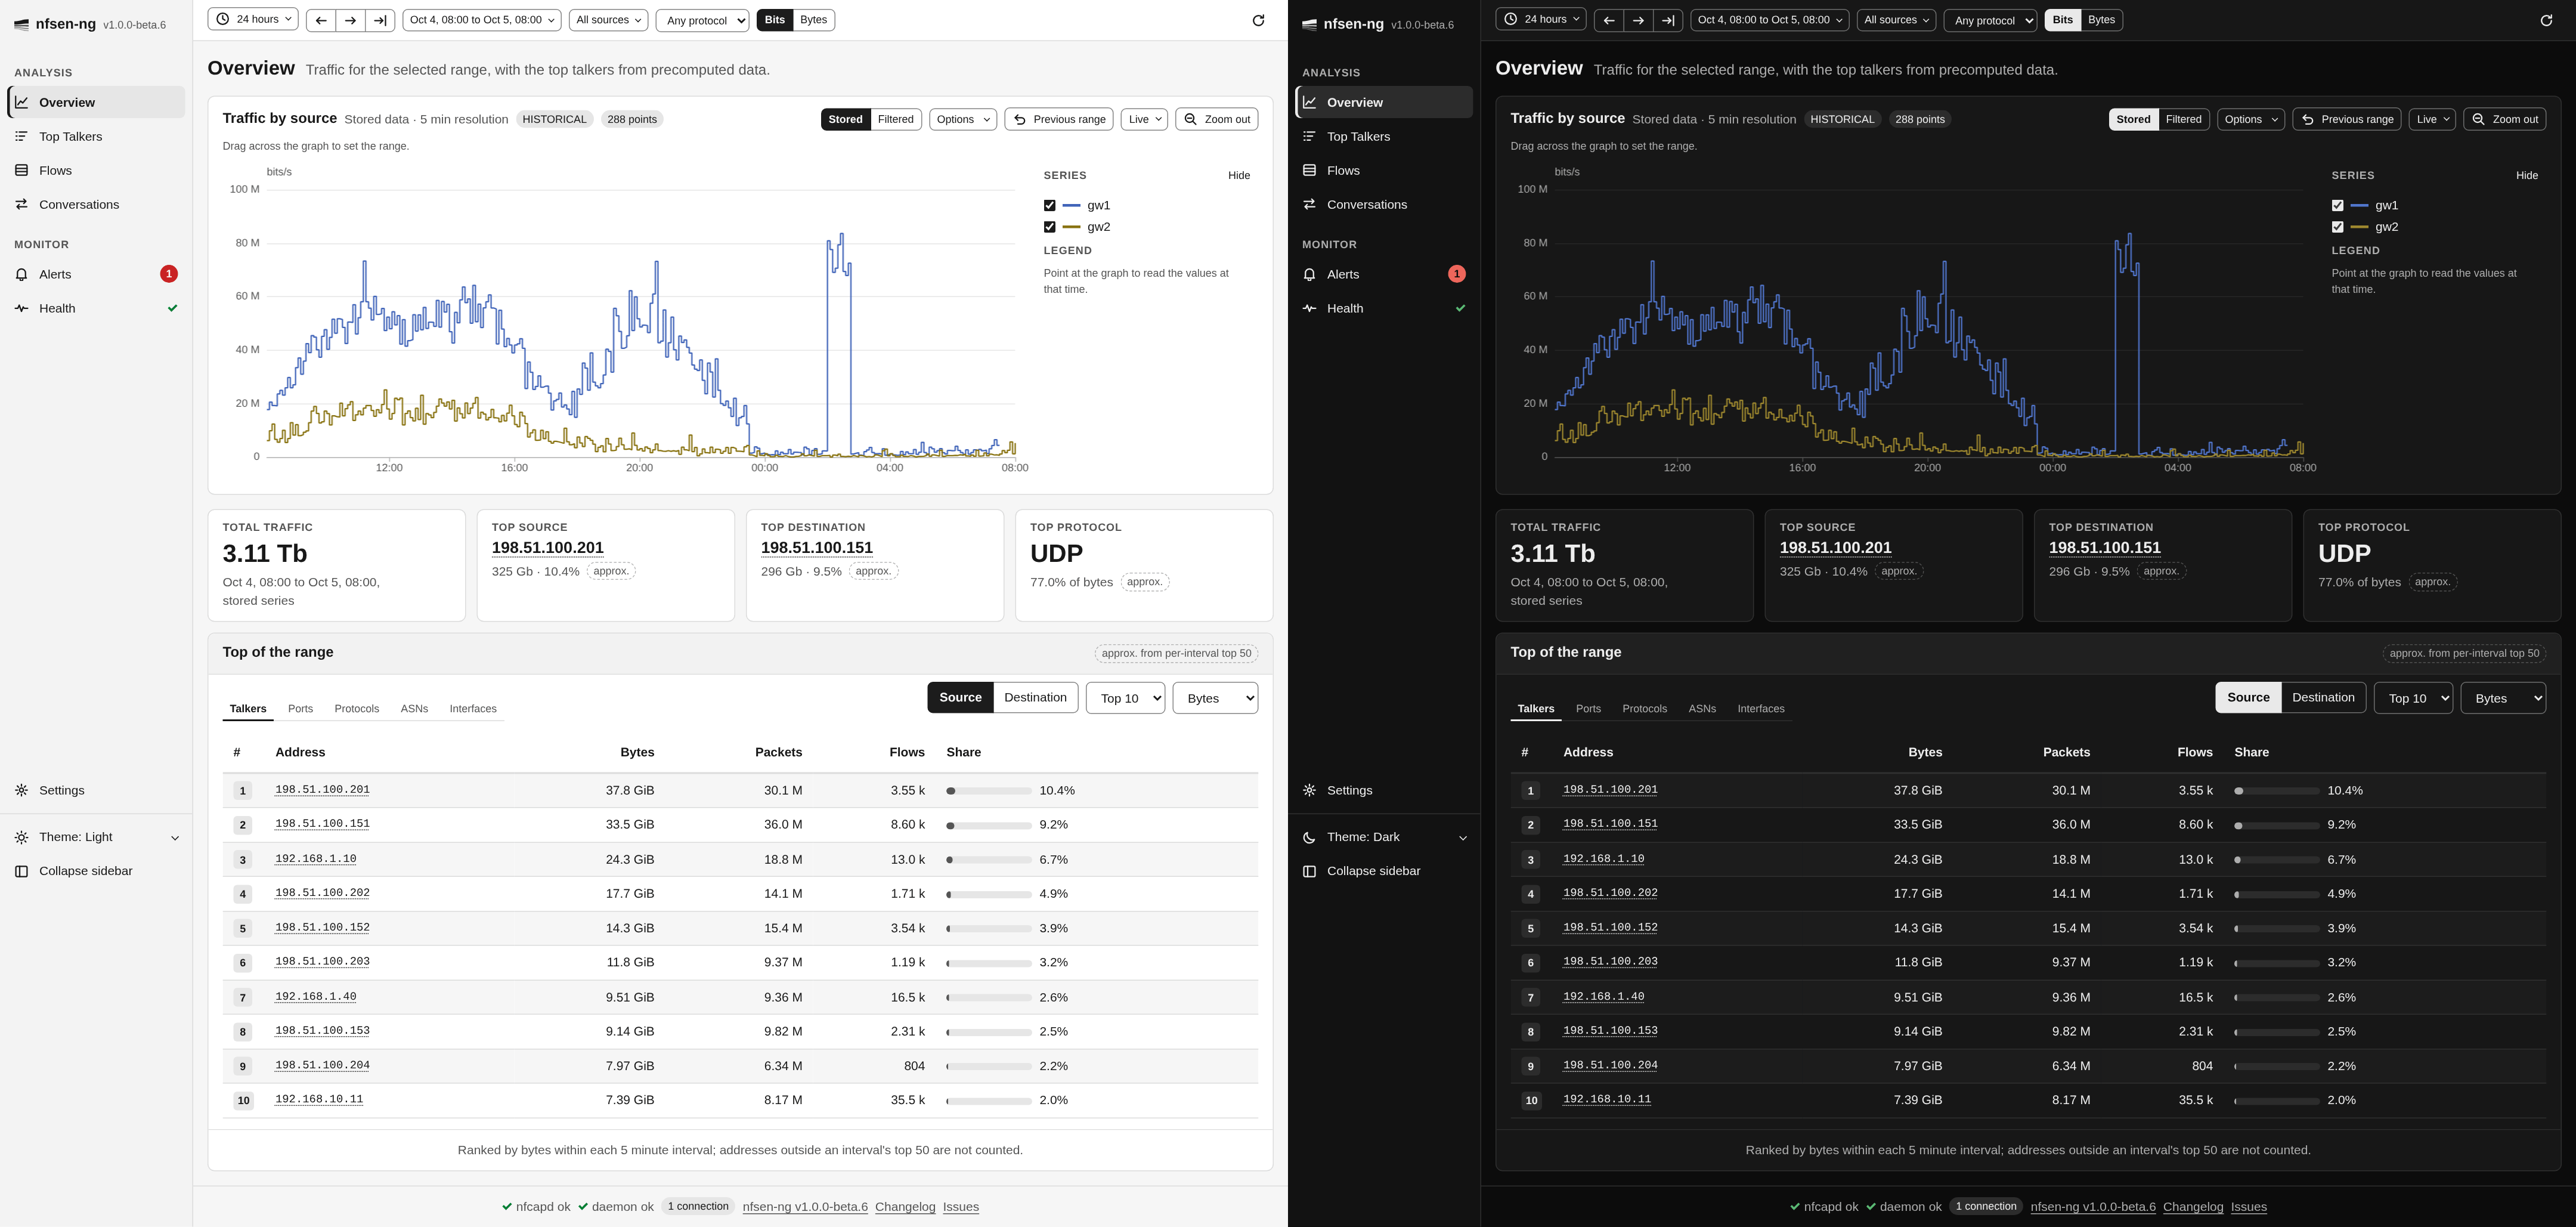
nfsen-ng opens on Overview: the traffic graph for the last 24 hours, four key figures, and the busiest addresses, ports and protocols of that range. An administrator can pick a different start page and range under Settings.
The sidebar
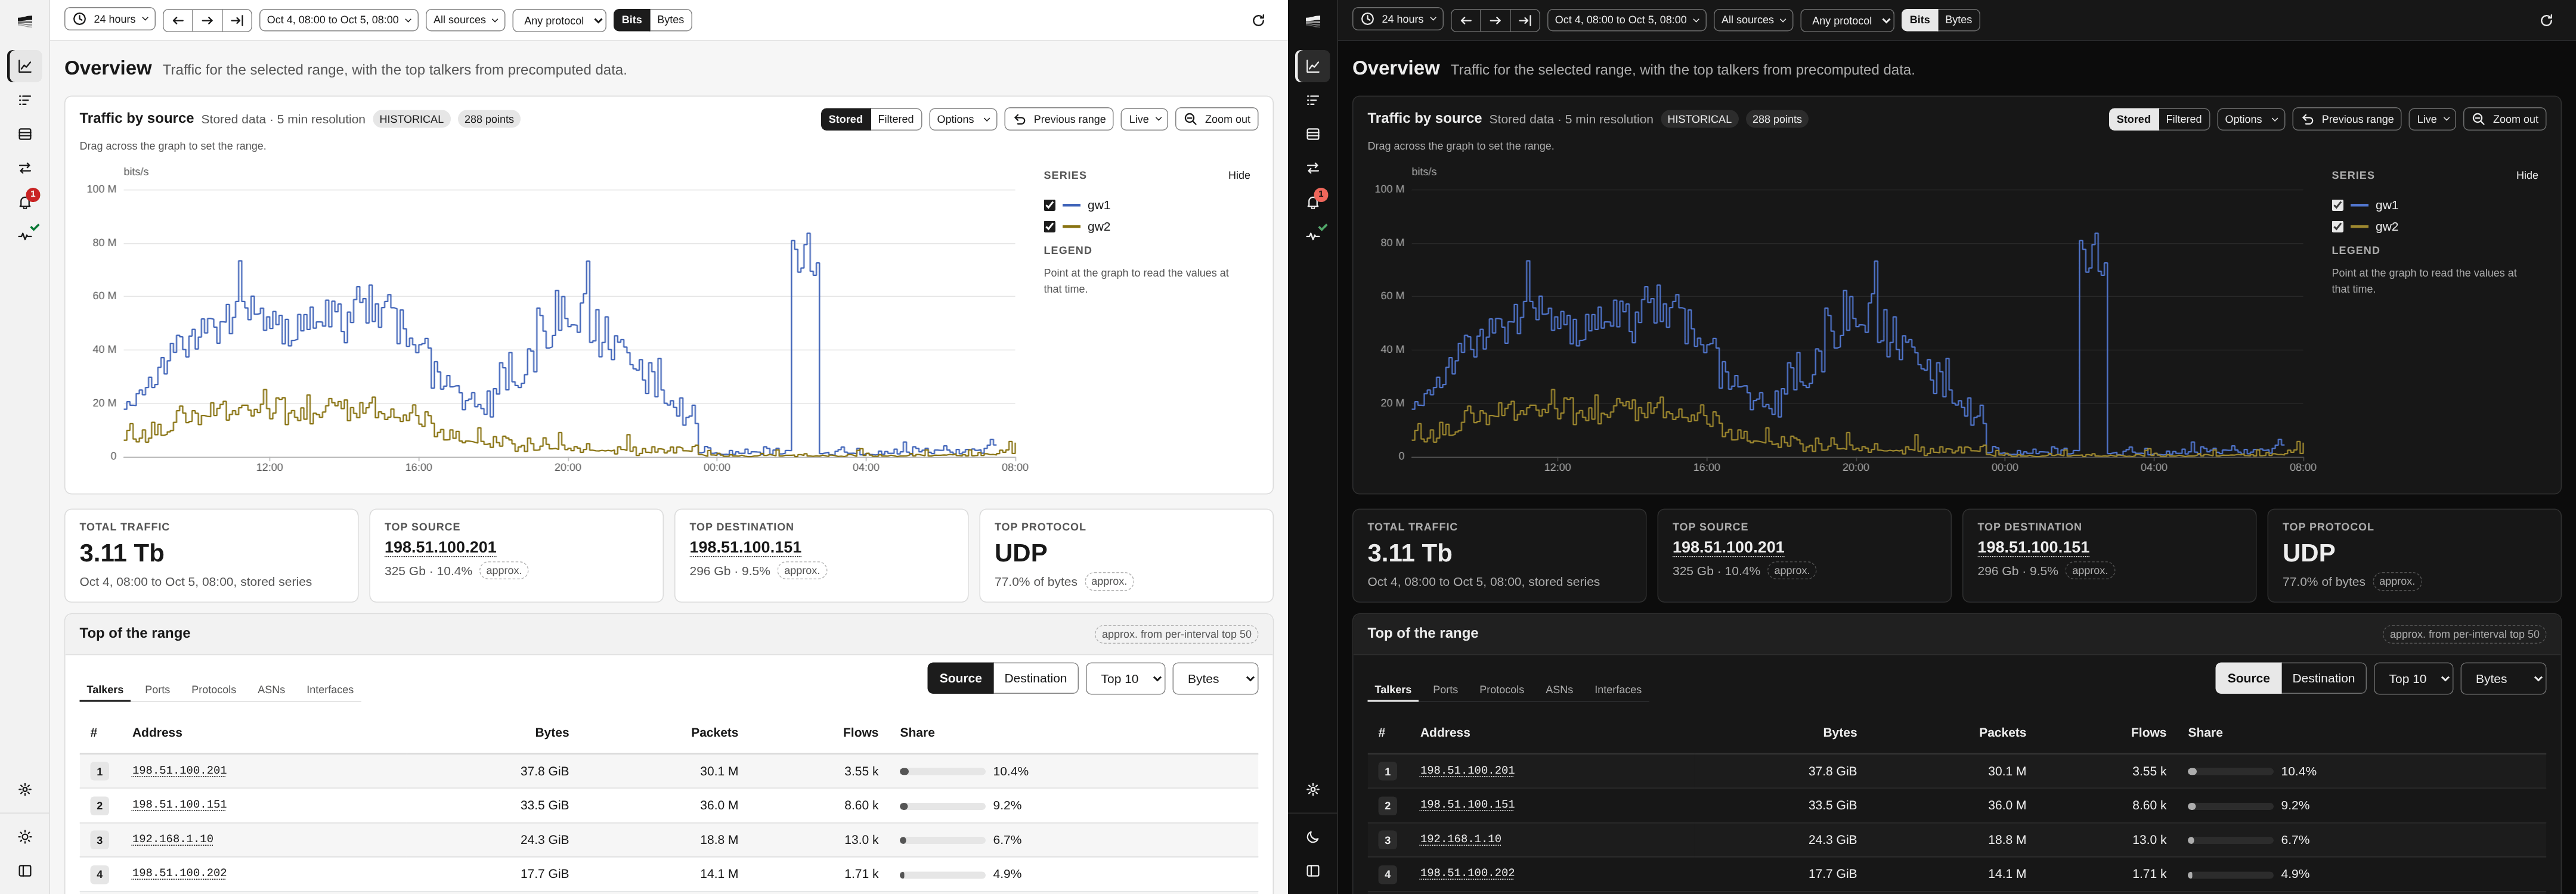
The sidebar on the left lists the pages in two groups. Analysis holds Overview, Top Talkers, Flows and Conversations, the four pages that read traffic; Monitor holds Alerts and Health. Settings sits at the bottom.
A few pages carry a status next to their name. Alerts shows a count while rules are firing, Health shows a dot coloured by the worst check result, and an import icon appears beside Health while an import runs. Each of them also says in words what it shows when you point at it.
Below the pages are the theme menu (Light, Dark, System, or Use instance default, which follows the choice in Settings) and Collapse sidebar, which shrinks the sidebar to its icons. Both are remembered by this browser only.
Every page has its own address, such as #/flows or #/alerts, so you can
bookmark a page, open it in a new tab with a middle click, and use the browser’s
back button between pages. Switching pages is instant, and what you entered on a
page is still there when you come back to it.
The controls bar
The bar at the top sets the time range and the scope for every page at once:

- Profile, at the start of the bar, appears only when there is more than one nfdump profile (see nfdump Profiles).
- The range menu (clock icon) names the current window. It offers the presets Last 1 hour, Last 24 hours, Last 7 days, Last 30 days and Last year, and a Custom duration: a number of hours, days or weeks, then Apply.
- Previous period and Next period step the window back or forward by its own width; Jump to now moves it to end now. Previous period is disabled at the start of the stored data.
- The start and end of the window are shown next to the step buttons, in the timezone Settings asks for. Click them to type an exact From and To.
- Sources picks which exporters count, as All sources or 2 of 5 sources. At least one stays checked.
- Protocol narrows everything to TCP, UDP, ICMP or Other, or leaves it at Any protocol.
- Bits or Bytes sets the unit for rates and volumes in the graphs and key figures. Result tables always count bytes.
At the end of the bar, a chip appears while an import runs (Import running with its progress and time left, Import behind when more than a dozen files are waiting, Import failed after a failed pass); it links to the Health page. A spinner appears there when the connection to the server drops (see below), and the last button reloads the page.
Live and historical windows
A preset, a custom duration and Jump to now make the window live: it keeps ending now, and the graph says LIVE with the time of its last update. Stepping back, or choosing a window that ends in the past, pins it, and the graph says HISTORICAL. Next period back up to now makes it live again.
The traffic graph
Overview, Top Talkers, Flows and Conversations show the traffic graph above the page. It reads the stored series, so it costs nothing and updates on its own. While the window is live it refreshes every 15 seconds on Overview and every minute on the other three pages, and every open page redraws it after each import.
What it plots depends on the page. Overview shows its own configuration (by source, protocol or port, see Overview); Top Talkers and Flows show Traffic by protocol; Conversations shows one Total traffic line. The line under the title says which data it is, e.g. Stored data · 5 min resolution.
The graph sets the range. Drag across it to make the dragged span the window of every page. The header has the other range tools:
- Previous range goes back to the window before your last change.
- Zoom out shows twice the time around the current window.
- Ctrl + mouse wheel zooms the graph without changing the range. The header then says Previewing and the zoomed span, with Apply (make it the range) and Reset. A plain mouse wheel scrolls the page.
- Live opens a menu with Follow live data (the same as live above), Follow graph zoom (apply every zoom at once instead of previewing it) and Sync zoom to range now.
- Select range, on a touch screen, arms the graph for one drag, since a swipe there scrolls the page.
Running queries
Everything that reads nfcapd capture files costs real time and disk I/O, so it
never starts on its own. The pages that do it (Top Talkers, Flows, Conversations,
and Overview’s filtered graph and exact run) show an estimate first: how many
capture files the query would read, how large they are, and about how long that
takes. The time comes from a default read rate until this server has recorded a
few runs of the same kind, then from their median. Large query marks a query
over 16 GiB, and last 7 days only means the administrator capped the window
with NFSEN_MAX_STATS_WINDOW.
Press Run (or Apply filter on the graph, Build graph for a Flows timeline) to start. The button shows how far along it is with a progress bar and the time left, and Kill stops it:

A result stays until you run again. When you change the filter, the range or any option afterwards, the result says These results are for an earlier query. Run again to update. When a live window has moved on by more than five minutes, it says which span it covers instead.
Filters
Every nfdump filter field checks what you type against nfdump itself, a moment after you stop typing, and says Valid filter or shows nfdump’s error. Its Builder and Saved buttons open the filter builder, with a field reference, examples and your saved filters.
The footer
The footer shows whether nfcapd is delivering (nfcapd ok, stale or no data), the state of the import daemon (ok, starting or disabled), how many browser connections the server has, the version, and links to the changelog and the issue tracker.
If you see a reconnecting spinner
nfsen-ng pushes live updates to your browser over a persistent connection (Server-Sent Events). If that connection drops (your laptop slept, a proxy timed out, the server restarted), a spinner appears at the end of the controls bar, next to the reload button. It reconnects automatically; you don’t need to reload, though the reload button never hurts if it seems stuck.
On a phone
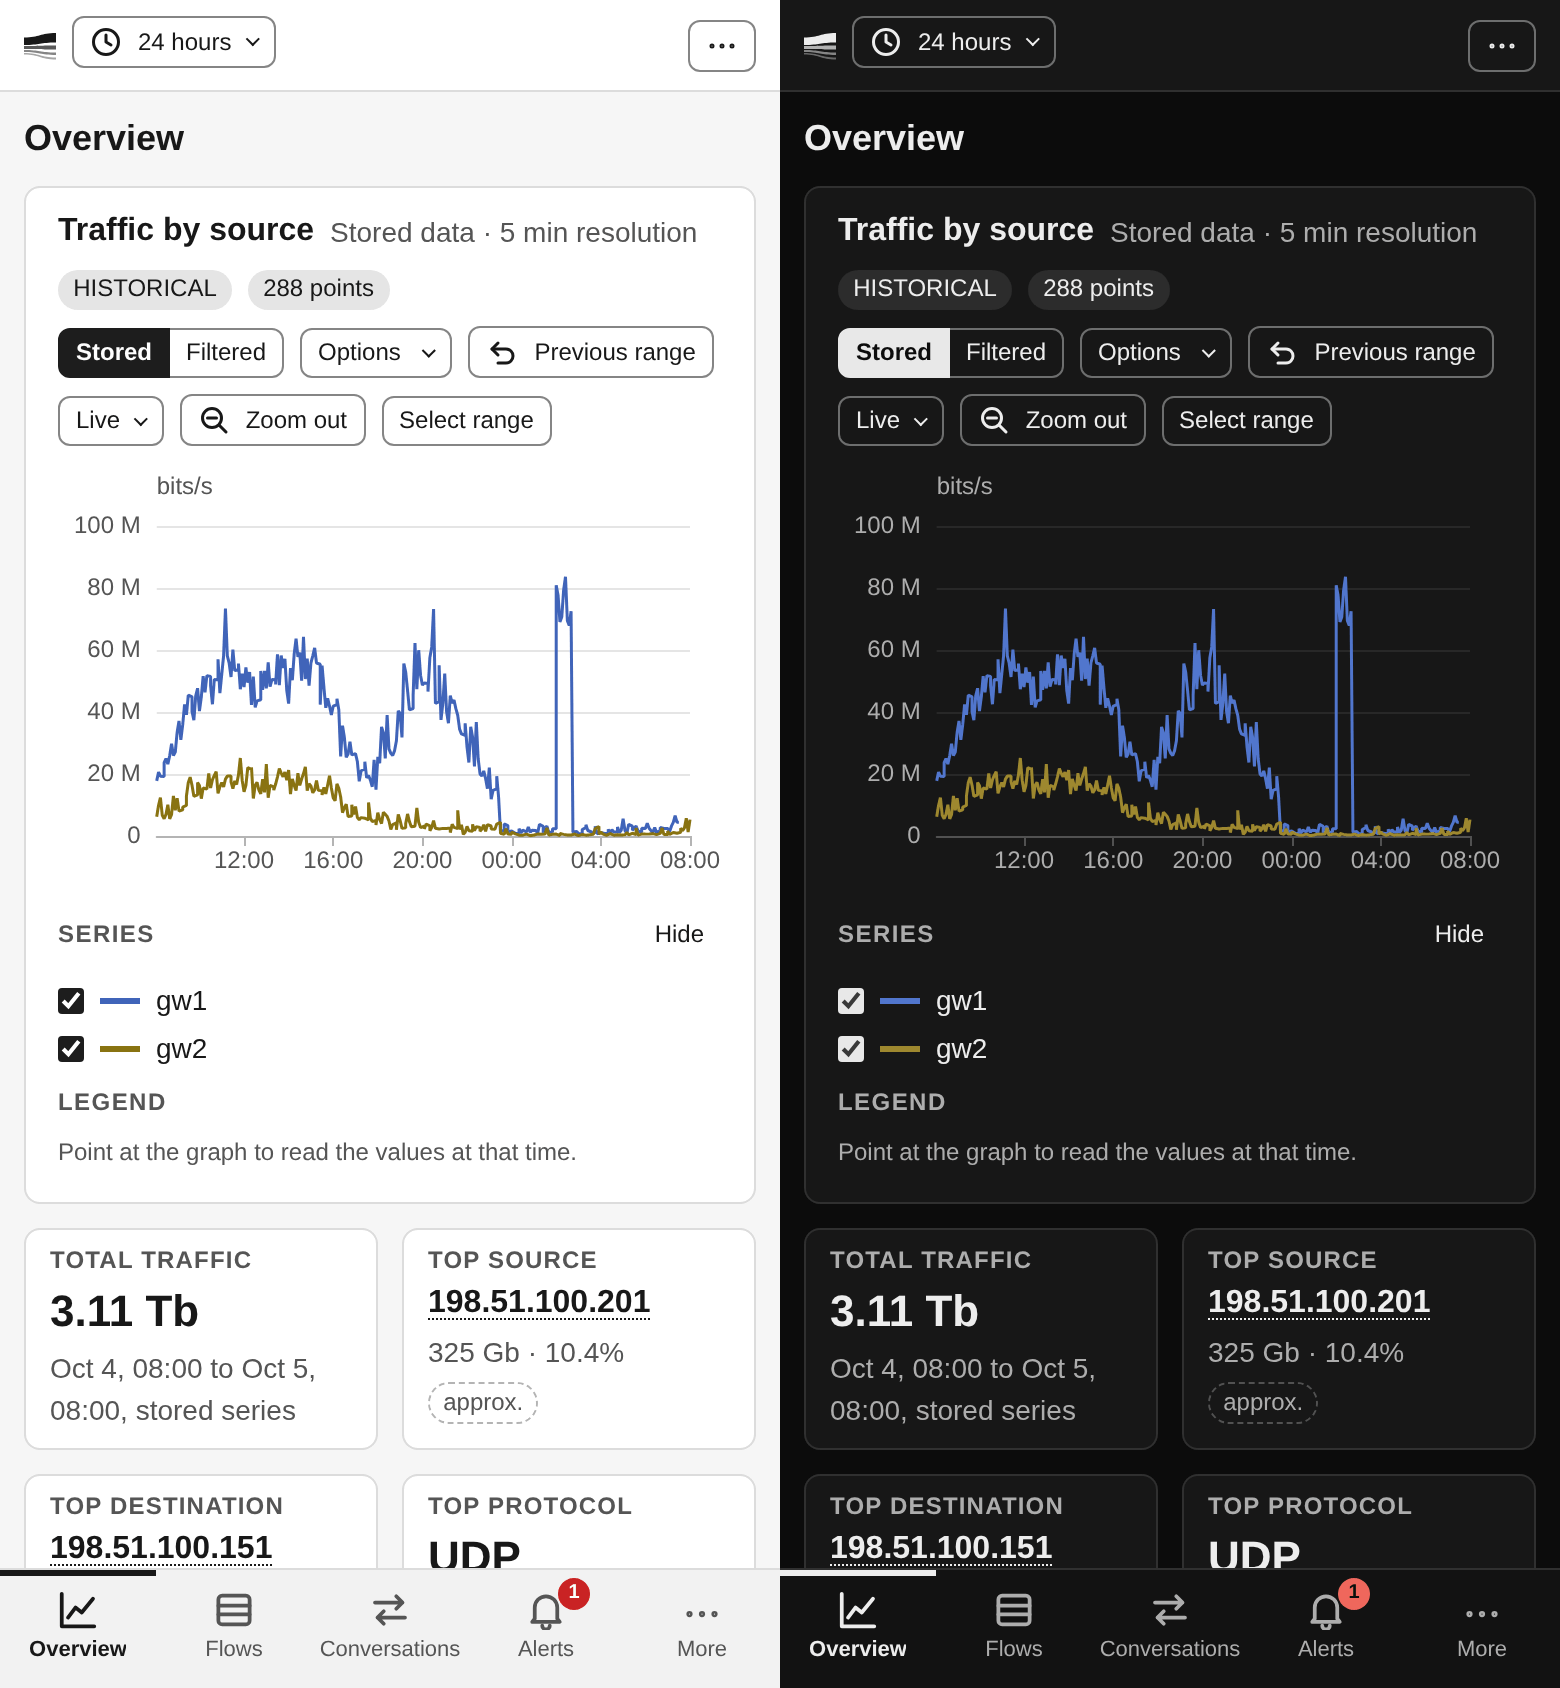
Below 768 pixels wide, the sidebar becomes a tab bar at the bottom with Overview, Flows, Conversations, Alerts and More. More holds Top Talkers, Health, Settings and the theme choice, and is marked while one of its pages is open. The graph comes first, the page follows in one column, the controls bar keeps the range menu and folds the rest behind More controls, and each query form folds behind Show filters.
Where to go next
- Overview: reading the traffic graph and the top lists, and graphing only what a filter matches
- Flows: searching individual flow records
- Setting Up Alerts: get notified when traffic crosses a threshold