Setting Up Alerts
Alerts watch a metric (flows, packets or bytes) and notify you when it crosses a threshold. They are checked automatically for every five-minute interval as the import brings it in, so nobody has to keep a browser open.
They live on the Alerts page:
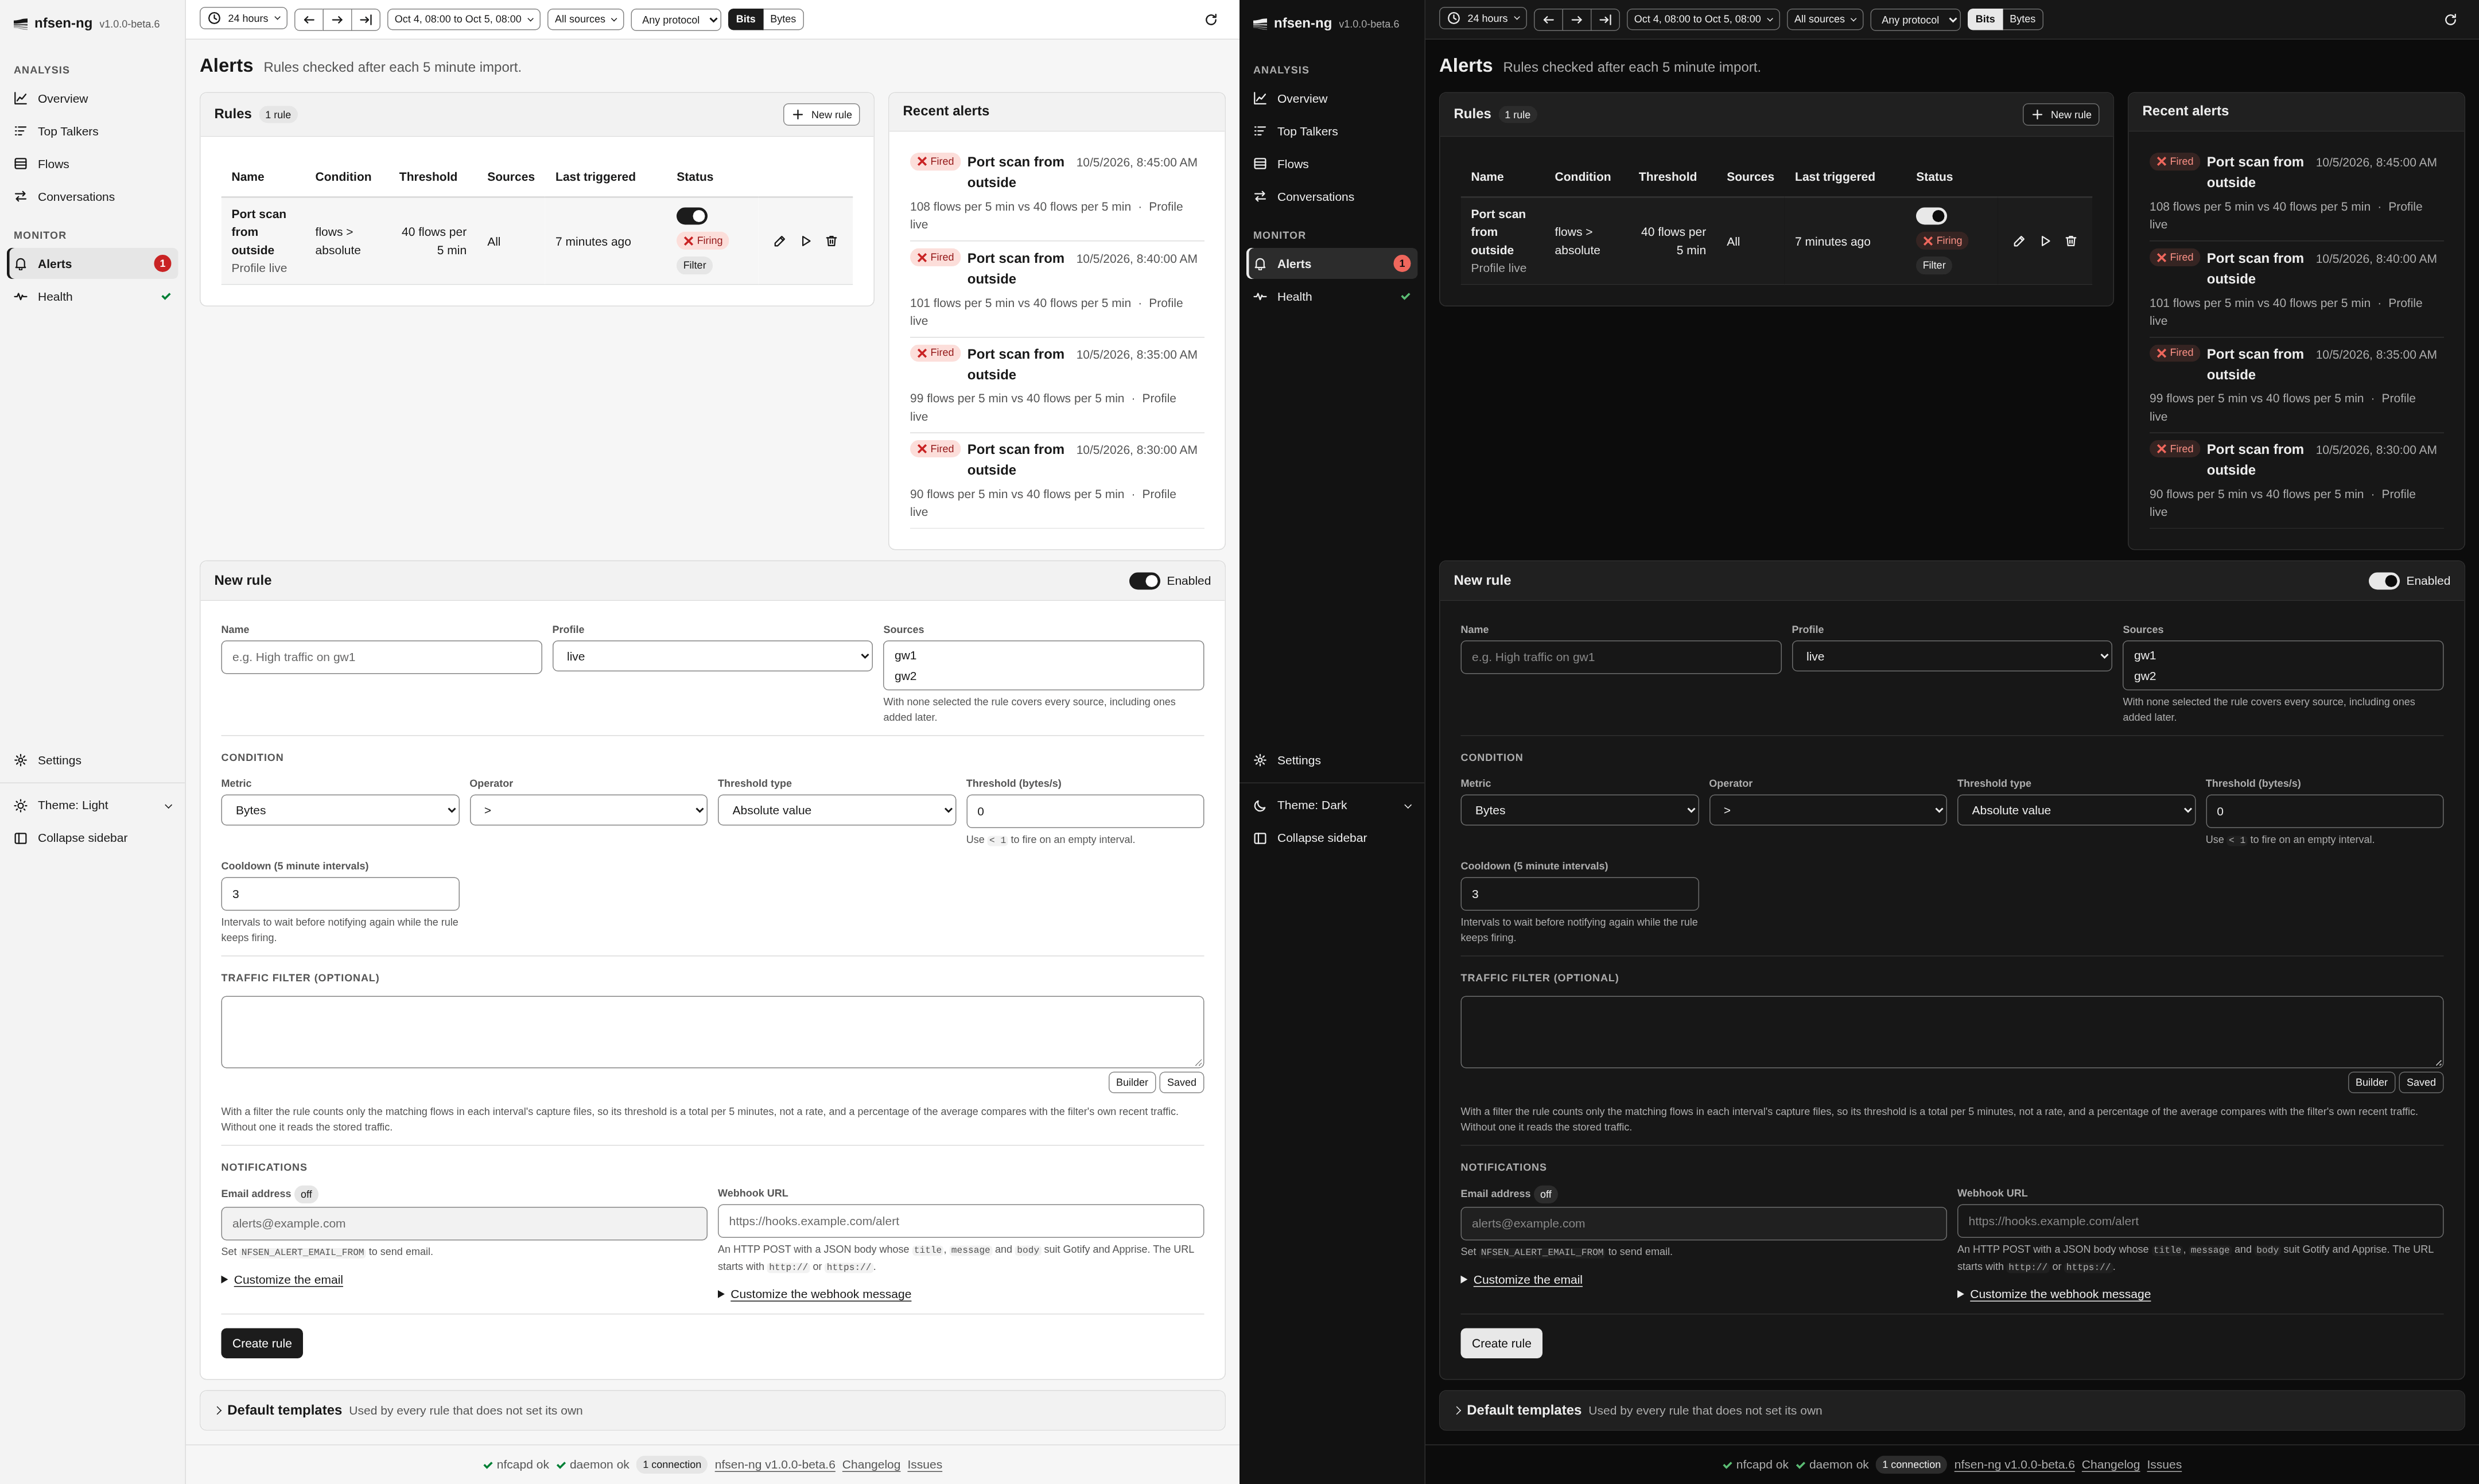
The Rules table lists every rule with its condition, threshold, sources, when it last fired (12 minutes ago, counting on while the page is open; point at it for the date and time), and a switch to turn it on or off. The status says OK, Firing or Disabled, and the sidebar shows how many rules are firing. Recent alerts beside it shows the last 50 events, newest first:
- Fired: the condition held for an interval (and a notification went out, unless the rule is in its cooldown).
- Resolved: a rule that had fired found the condition false again on a later interval. This is recorded but not notified.
- Test: somebody pressed Test on the rule.
Creating a rule
Press New rule and fill in the form below the table:
- Name: anything memorable, e.g. “High traffic on gw1”.
- Profile: which nfdump profile the rule watches (usually
live). - Sources: the exporters to add up. With none selected the rule covers every source, including ones added later.
- Condition: pick a Metric (Flows, Packets, Bytes), an Operator
(
>,>=,<,<=), a Threshold type and a value:- Absolute value: fire when the metric crosses this number. Use
< 1to fire on an empty interval. - % of rolling average: fire when the metric is this percent of its own average over the window you choose in Average over (10 min to 24 h), before the interval checked. Use this for “alert me when traffic is unusually high for this network” rather than a fixed number that might be normal for one link and alarming for another. A rule of this type waits until there is an average to compare with, and skips intervals while the average is zero.
- Absolute value: fire when the metric crosses this number. Use
- Cooldown (5 minute intervals): how many intervals to wait before notifying again while the rule keeps firing, so a sustained spike doesn’t flood you.
- Notifications: an email address and/or a webhook URL. Email works only
when the administrator set a sender address (
NFSEN_ALERT_EMAIL_FROM); the form says when it is off. Leave both empty for a rule that only shows up on this page.
The switch in the form’s header decides whether the rule starts enabled. Press Create rule. To change a rule, press its Edit button; the form fills in, the button says Update rule, and Cancel edit leaves the rule as it was.
Scoping an alert to specific traffic
By default a rule watches all traffic of its sources. Often you want something narrower: “alert only on ICMP”, “alert only for this subnet”. That is what the Traffic filter field is for:

Type any nfdump filter, the same syntax as on Flows; the field checks it against nfdump as you type, and Builder and Saved open the filter builder. A rule with a filter nfdump rejects cannot be saved.
| You want to watch | Traffic filter |
|---|---|
| Only ICMP traffic | proto icmp |
| Only one subnet | net 192.168.1.0/24 |
| Traffic from one subnet, TCP only | src net 10.0.0.0/8 and proto tcp |
With a filter, the rule runs a small nfdump query over the interval’s capture files and counts only the matching flows. Its value is then a total per five minutes, not a rate, so set the threshold accordingly. Without a filter it reads the stored series, which is cheaper and all you need for a general high-traffic alert.
With a filter, % of rolling average compares with the filter’s own recent traffic, not with all traffic: at every check, an enabled rule records how much its filter matched in that interval, and averages those records. So:
- A new or edited rule has no average yet. It starts comparing after it has checked one interval, and its average covers the full window only once it has run that long. Changing its profile, sources, filter or metric starts the average over.
- A rule has no average while its filter matched nothing in the window. A rule
that should fire on traffic that is normally absent (any ICMP on a quiet link)
needs an Absolute value instead, such as
> 0. A below rule that is firing stays firing while its filter matches nothing. - Alerts such a rule recorded before this version show their old threshold labelled as a total per five minutes; that threshold was a per-second average of all traffic.
When rules are checked
Every rule is evaluated once per five-minute interval and profile, as soon as every source has delivered its capture file for that interval, in whatever order the files arrive. A source that has nothing waiting once a later interval is in counts as down and is left out until it reports again, so one dead exporter does not stop the rules of the others.
Customizing the notification text
By default, email and webhook notifications use a fixed subject/title and body/message. You can override this, for example to phrase Gotify or Apprise notifications your own way, or to put the actual traffic numbers into the message.
There are three levels, checked in order: a rule’s own override (if set), then a global default (if set), then the built-in text shown as each field’s placeholder.
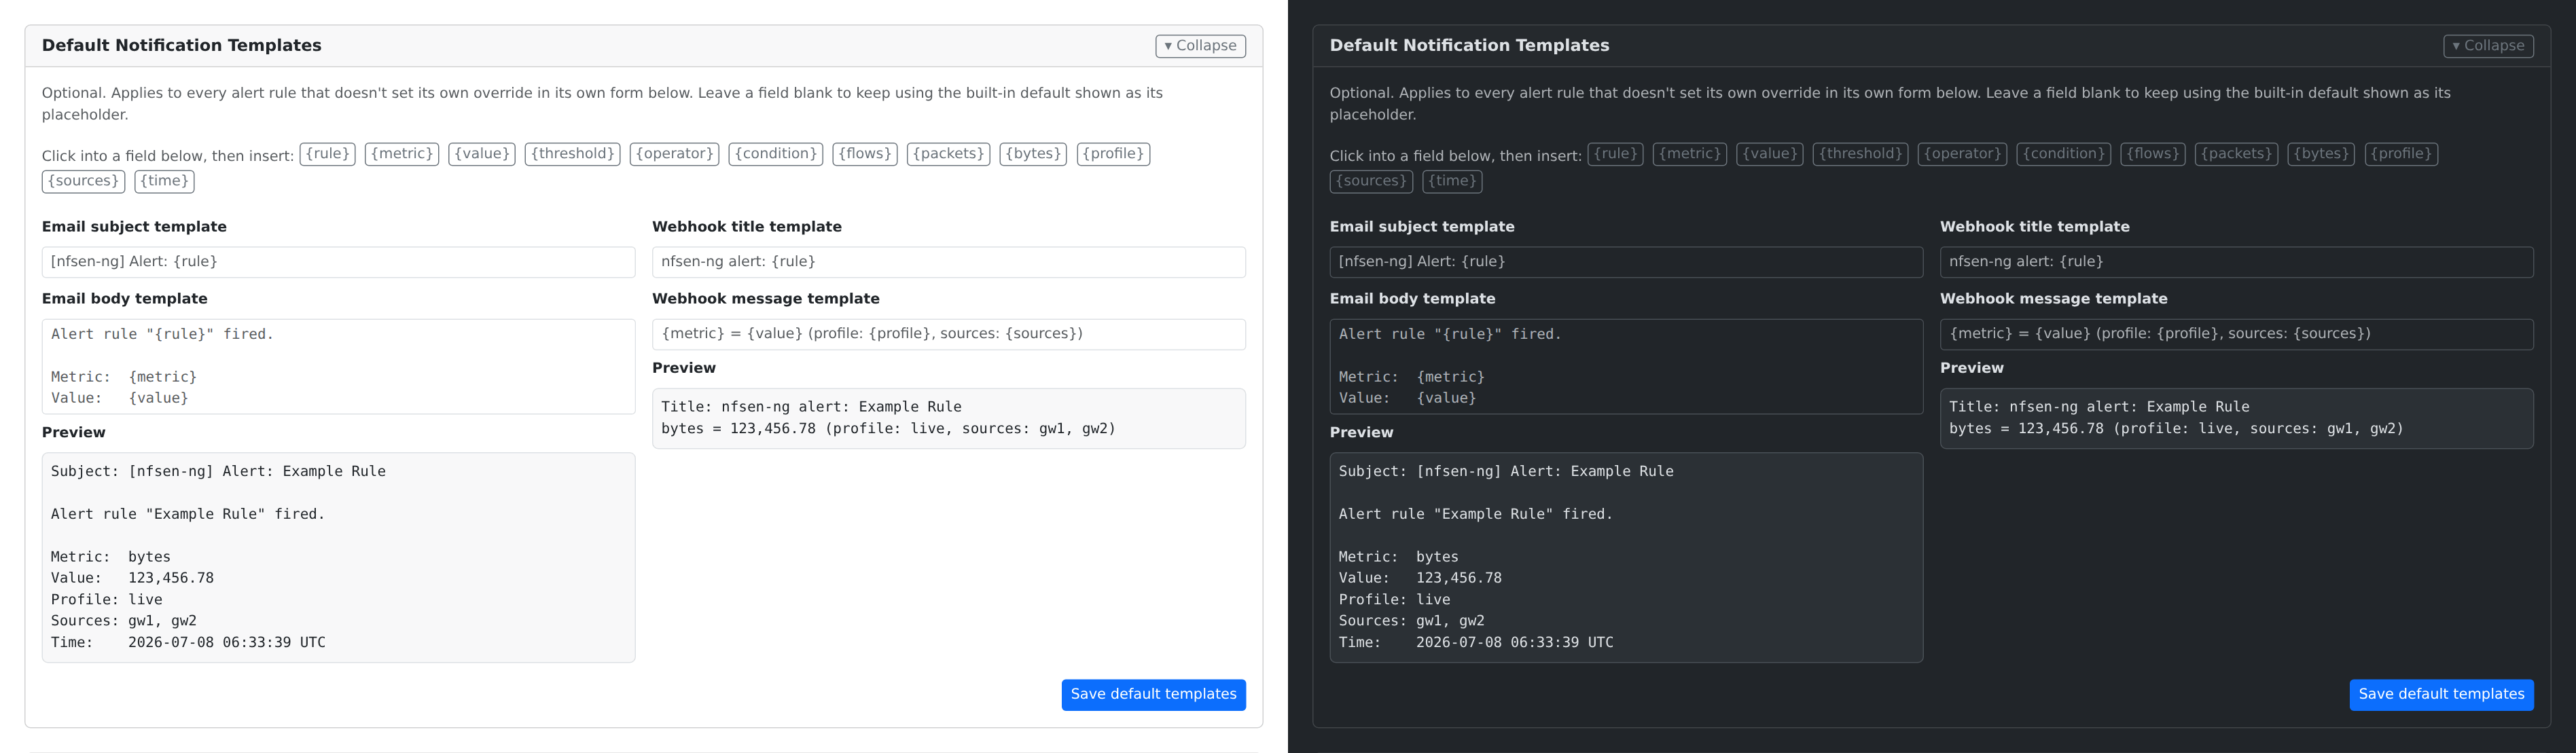
Global defaults apply to every rule that doesn’t set its own override. Open Default templates below the rule form, edit, and save them there:
Per-rule overrides live in the rule form, folded behind Customize the email and Customize the webhook message under the email address and the webhook URL:
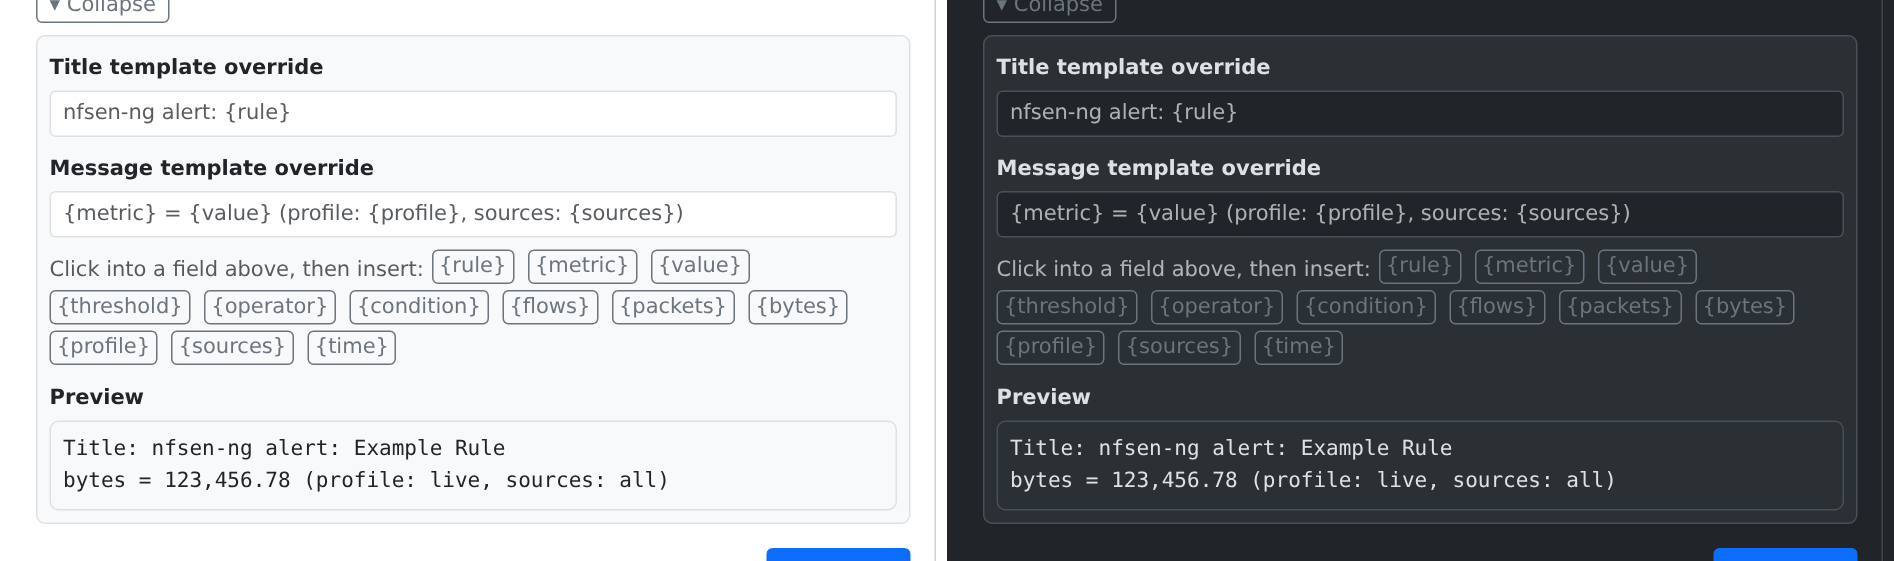
Either way, click into a template field, then click one of the variable buttons to insert it at your cursor:
| Variable | Value |
|---|---|
{rule} | Rule name |
{metric} | Which metric fired (flows, packets, or bytes) |
{value} | That metric’s value in the interval |
{threshold} | The threshold that was crossed |
{operator} | The comparison operator (>, >=, <, <=) |
{condition} | {metric} {operator} {threshold}, combined |
{flows}, {packets}, {bytes} | All three counters, regardless of which one the rule watches |
{profile} | The nfdump profile |
{sources} | The rule’s sources, comma-separated; all configured sources when the rule has none selected |
{time} | The start of the data interval that fired, in UTC |
The Preview under each pair of fields updates as you type, using made-up example numbers: it previews the template, not a real alert. To see the real text for a rule, use Test.
Testing before you rely on it
Test in a rule’s row evaluates it right away against the newest complete interval, with the same sources the live evaluation would use (a source that is down is left out), and opens a dialog with the answer:
- Would fire or Would not fire, with the value and the threshold it was compared with, or why there is none yet;
- what happened with each notification channel: Sent (the email with its
address), Failed with the reason (the webhook’s HTTP status, for example),
Not configured, or Not sent because the rule would not fire. An email
address on a server without a sender (
NFSEN_ALERT_EMAIL_FROM) shows as not configured on this server. Test waits up to ten seconds for the webhook to answer; - the start of the interval it tested;
- the email subject and body and the webhook title and message, rendered with the real figures.
A test that fires sends the notification for real, so you can check the email or the webhook receiver too. It is recorded as a Test event and does not touch the rule’s firing state or cooldown. Test a rule after creating or editing it, especially one with a traffic filter, before trusting it to notify you unattended.