Flows
Flows lists individual flow records for the range: the detail behind the graphs and rankings. Use it when you know roughly when something happened and want to see exactly what.
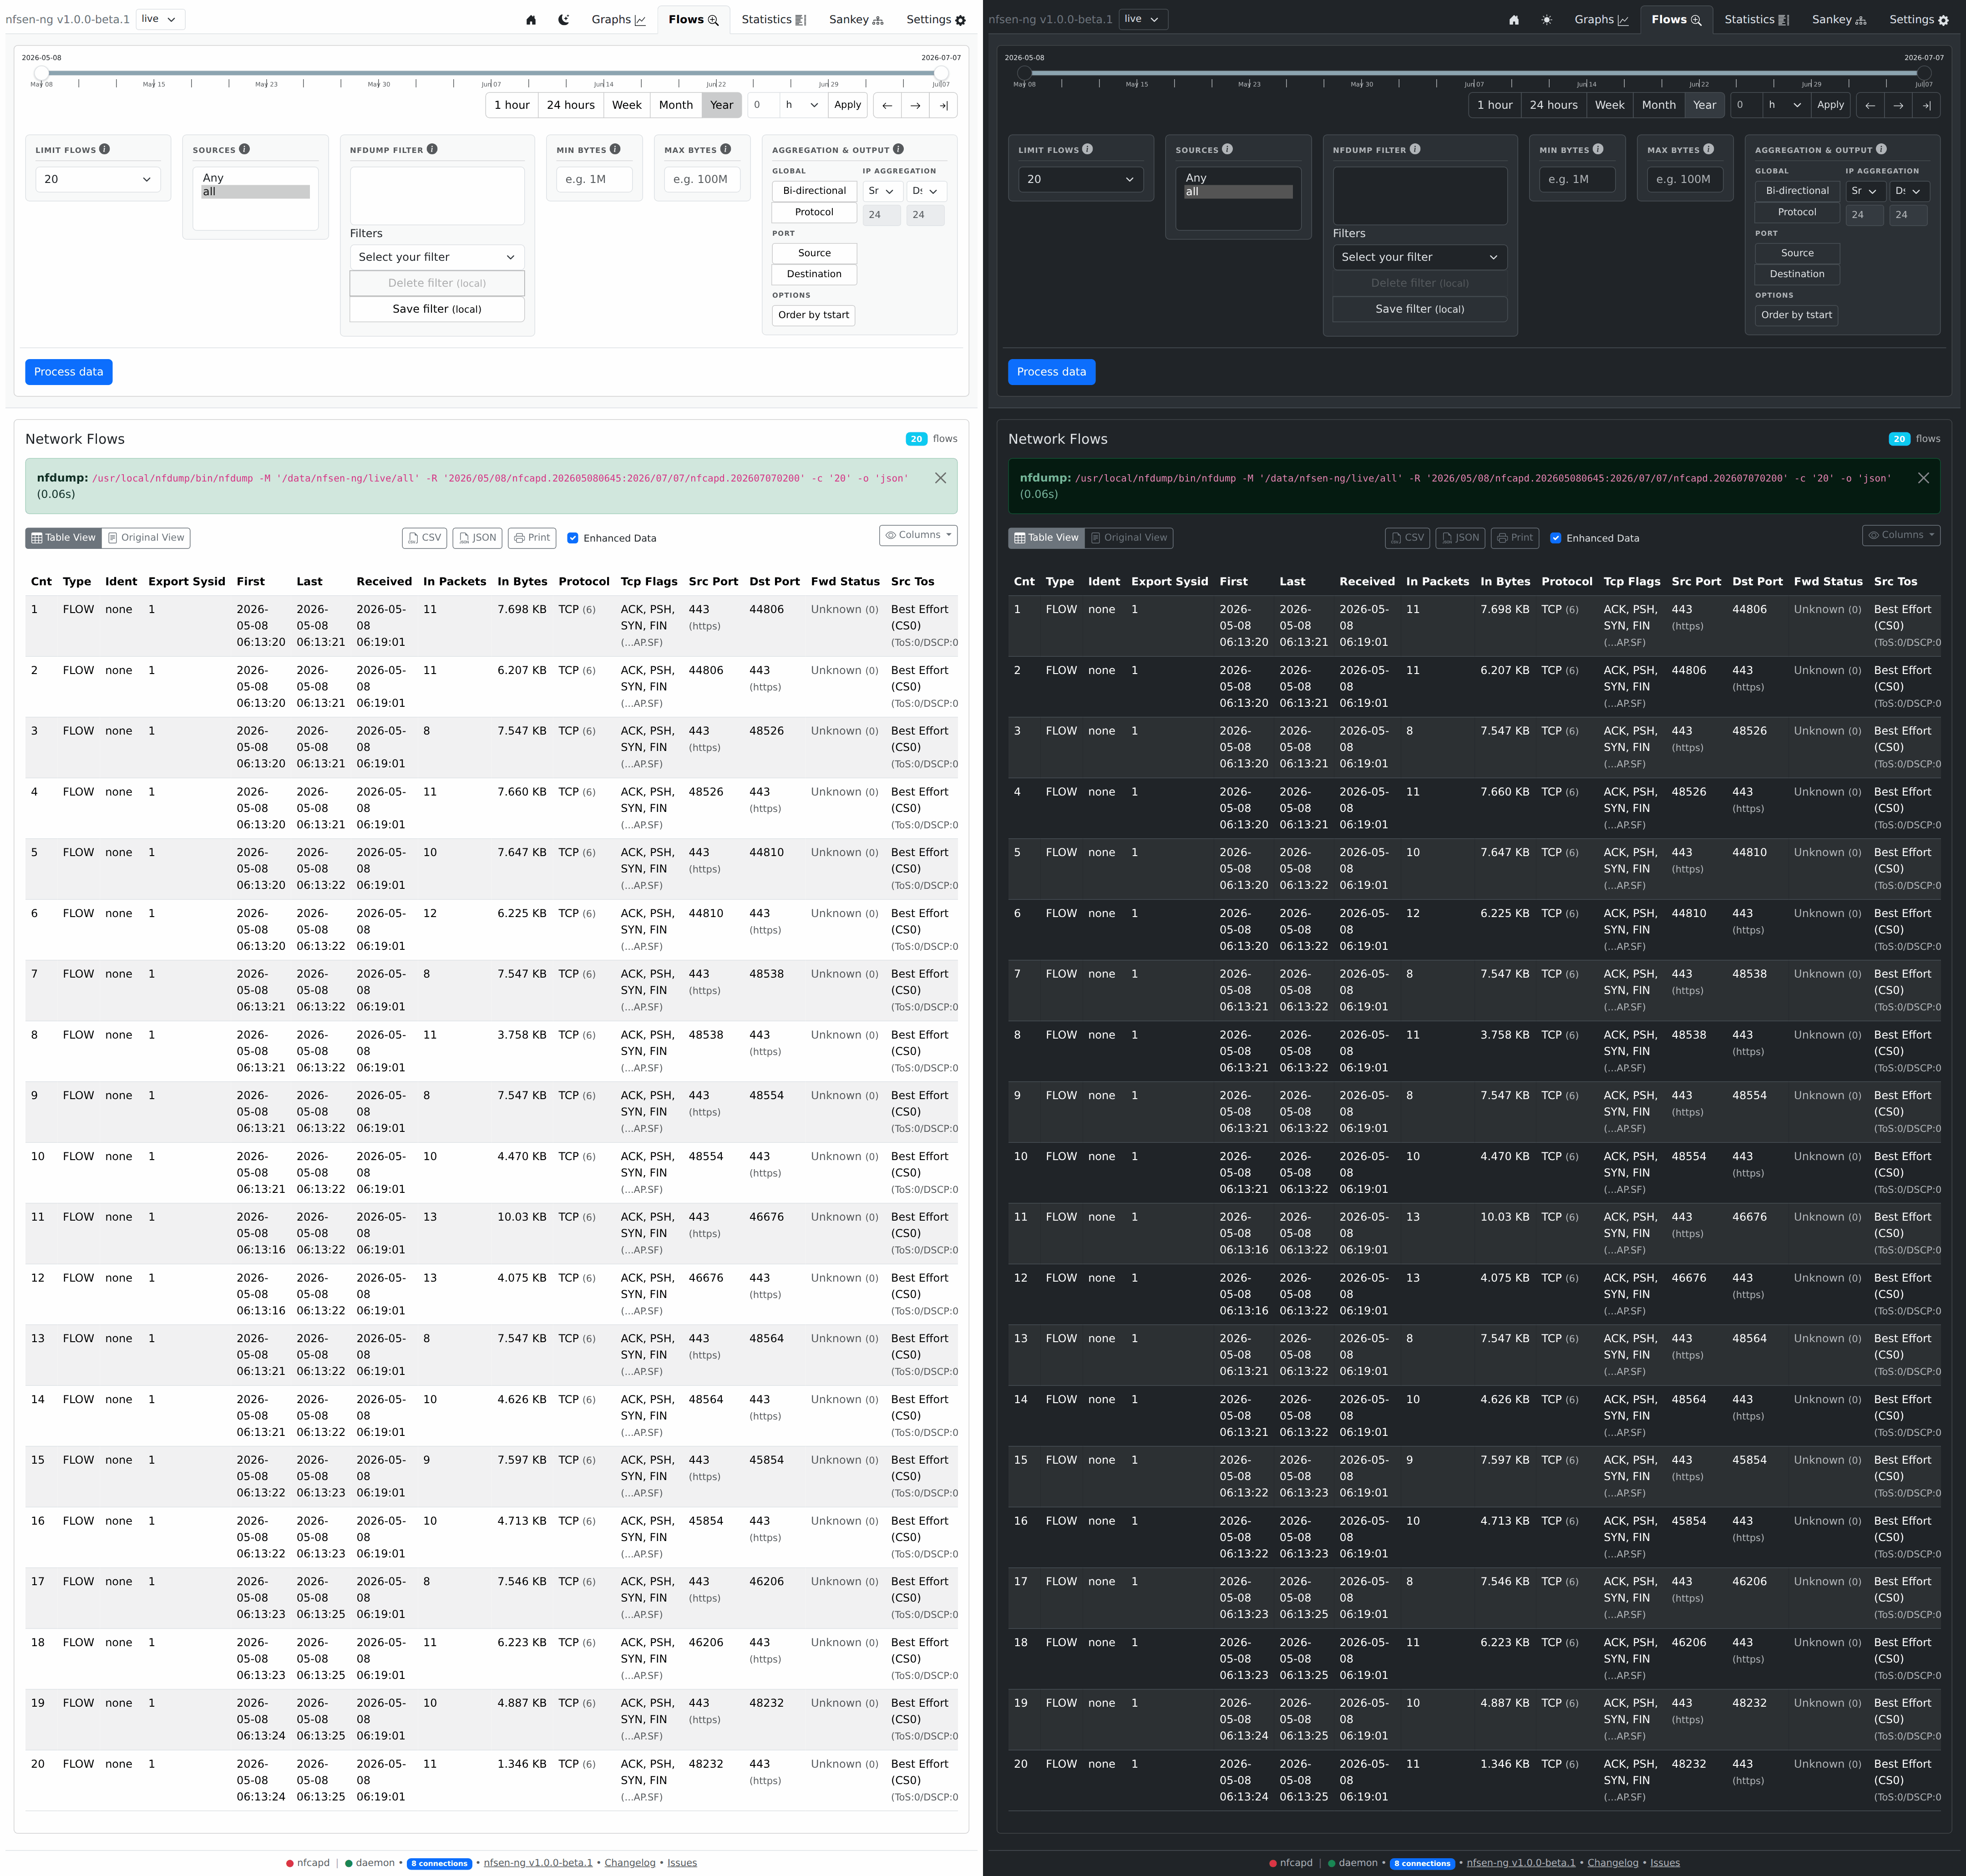
Setting up a query
The Query card holds everything specific to this page; the range, the sources and the protocol come from the controls bar.
| Control | What it does |
|---|---|
| nfdump filter | Free nfdump filter syntax, e.g. proto tcp and dst port 443, checked against nfdump as you type |
| Limit | How many rows nfdump returns (-c): 20, 50, 100, 500, 1,000 or 10,000 |
| Bytes per flow | Min and Max, added to the filter as bytes > min and bytes < max (accepts k, M and G) |
| Aggregation and output | Folded away by default, see below |
If you don’t know nfdump’s filter syntax yet, start simple (proto icmp,
net 192.168.1.0/24, dst port 22) and combine with and and or, or open
Builder next to the field for a reference of every field and a list of
examples. Saved lists the filters you saved; see
Filter builder.
The Estimate card next to the query says what a run would read before you start it: the number of capture files, their size, and how long that takes at most. A Flows query stops as soon as nfdump has the rows the limit asks for, so the time is an upper bound and says stops early once the limit is reached.

Press Run to start. The button shows how far nfdump has read and the time left, and Kill stops the run.
Aggregation and output
To summarise rather than list every flow, open Aggregation and output:
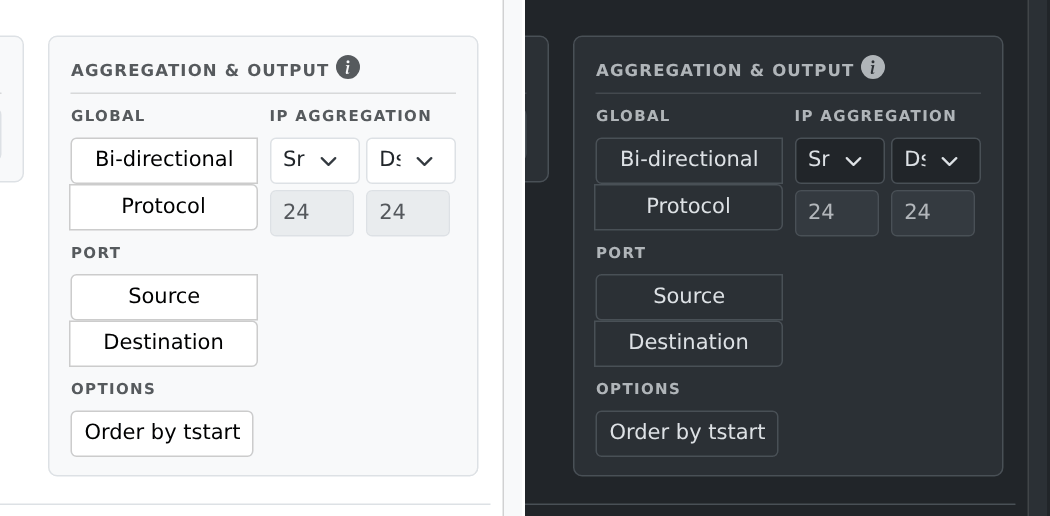
- Global: Bi-directional combines both directions of a conversation into one row, and Protocol collapses by protocol.
- Port: Source and Destination collapse by port.
- IP Aggregation: per direction, collapse addresses to the exact IP or to an IPv4 or IPv6 prefix such as a /24, instead of listing every host.
- Order by start time sorts the returned rows. nfdump still stops after the limit in file order, so it sorts what came back, not the whole range.
These map onto nfdump’s own aggregation (-a, -A and -B): the panel is a
form over nfdump’s options, not a reimplementation of them.
Reading the result
The result has three tabs, and the line next to them says how many rows came back and whether the limit was reached (or, for an aggregated query, how many flows were aggregated).
Flows is one list of every row that came back: scroll it, or walk it with Tab, and the server sends the rows as they come into view. nfdump cannot skip rows, so when the limit is reached the line next to the tabs says so: raise the limit to see more. Click a column header to sort (again for the other direction), use Columns to hide columns, and Export to save every row as CSV or JSON or print them; the next Run keeps the sort and the hidden columns. With Enhanced data on, the export has the values as shown; off, it has the raw numbers. Click an IP address to look it up.
Raw output is what nfdump printed, untouched: the command it ran (with Copy, handy for running the same query in a terminal), the lines nfdump printed beside the data, and its output with Copy and Download. The page keeps the first 5 MiB of a very large output and says so. A Copy button waits for output still on its way, works on an instance served over plain HTTP too, and answers Copied, Nothing to copy or Copy failed; a screen reader hears the same.
Summary puts the rows into context, in three blocks:
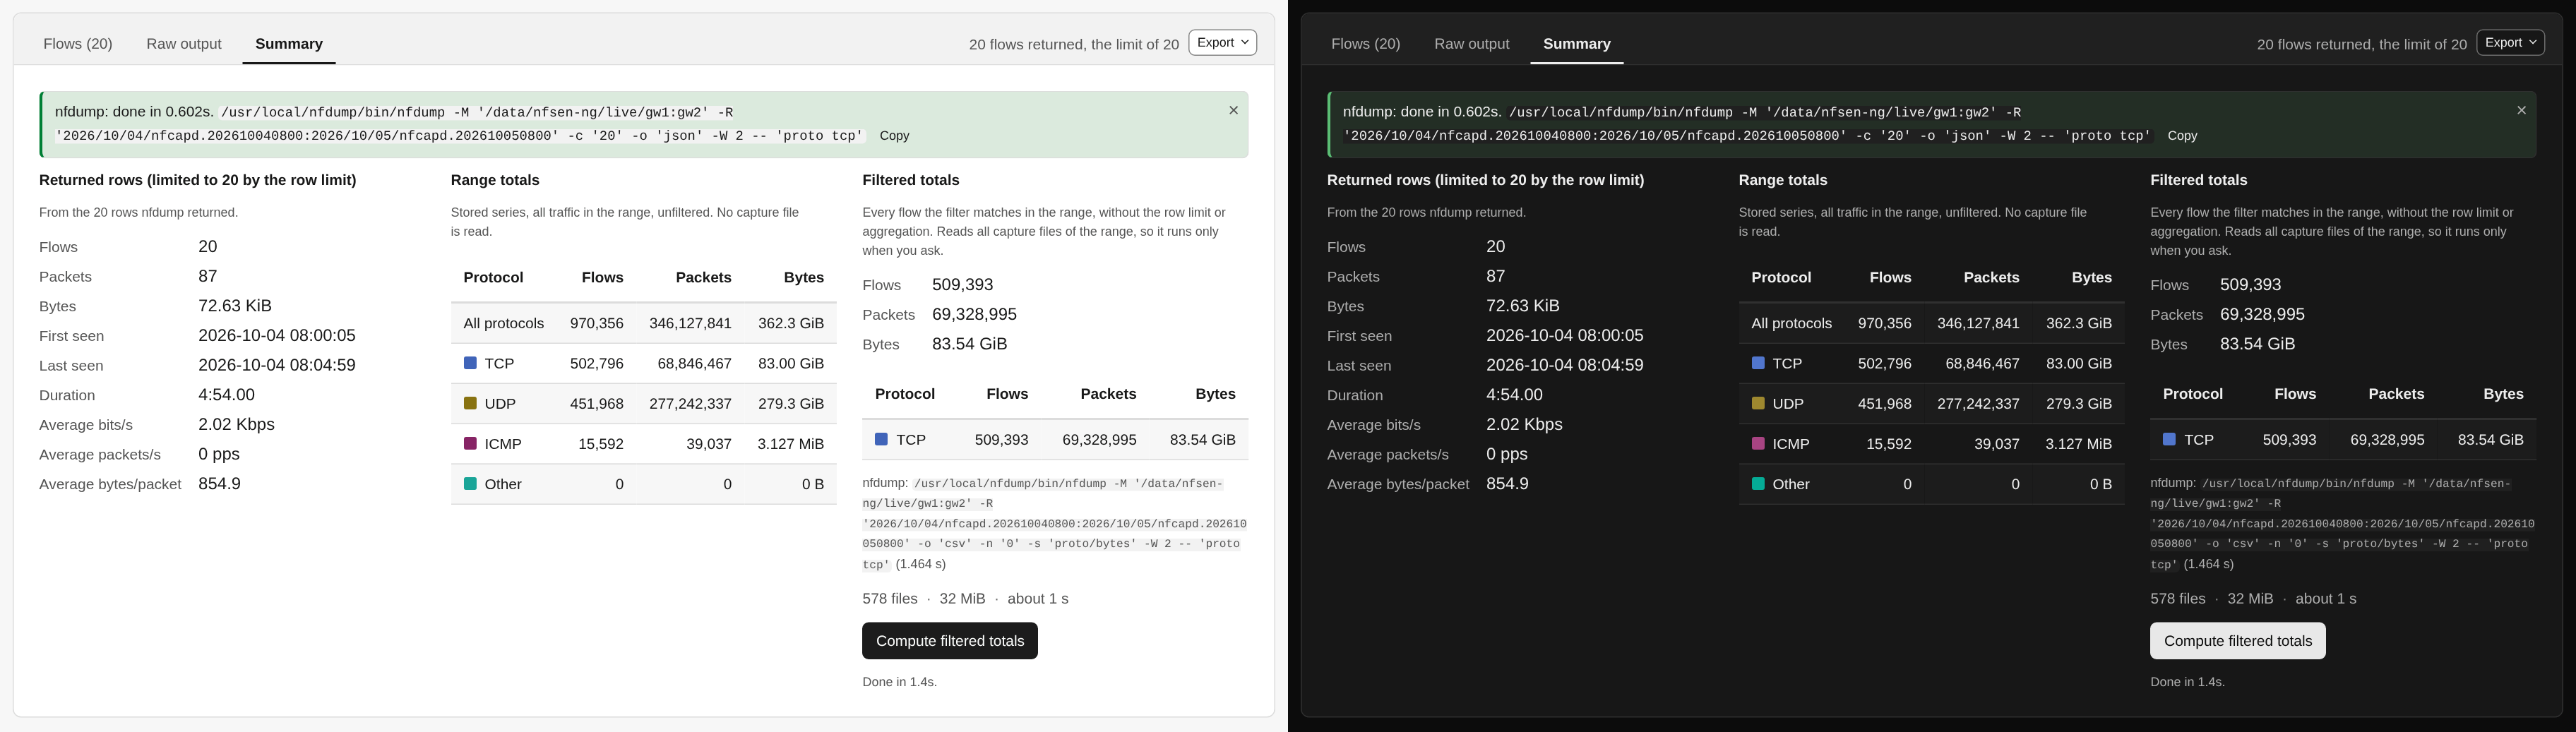
- Returned rows: flows, packets, bytes, first and last seen, duration and averages of the rows nfdump returned, which the row limit may have cut short.
- Range totals: all traffic of the range from the stored series, unfiltered, split by protocol. No capture file is read, so it is there right away.
- Filtered totals: every flow the filter matches in the range, without the row limit or aggregation. That reads every capture file of the range, so it has its own estimate and runs only when you press Compute filtered totals.
Seeing when your flows happened
Traffic over time, the folded section between the query and the result, plots the current filter over the range:
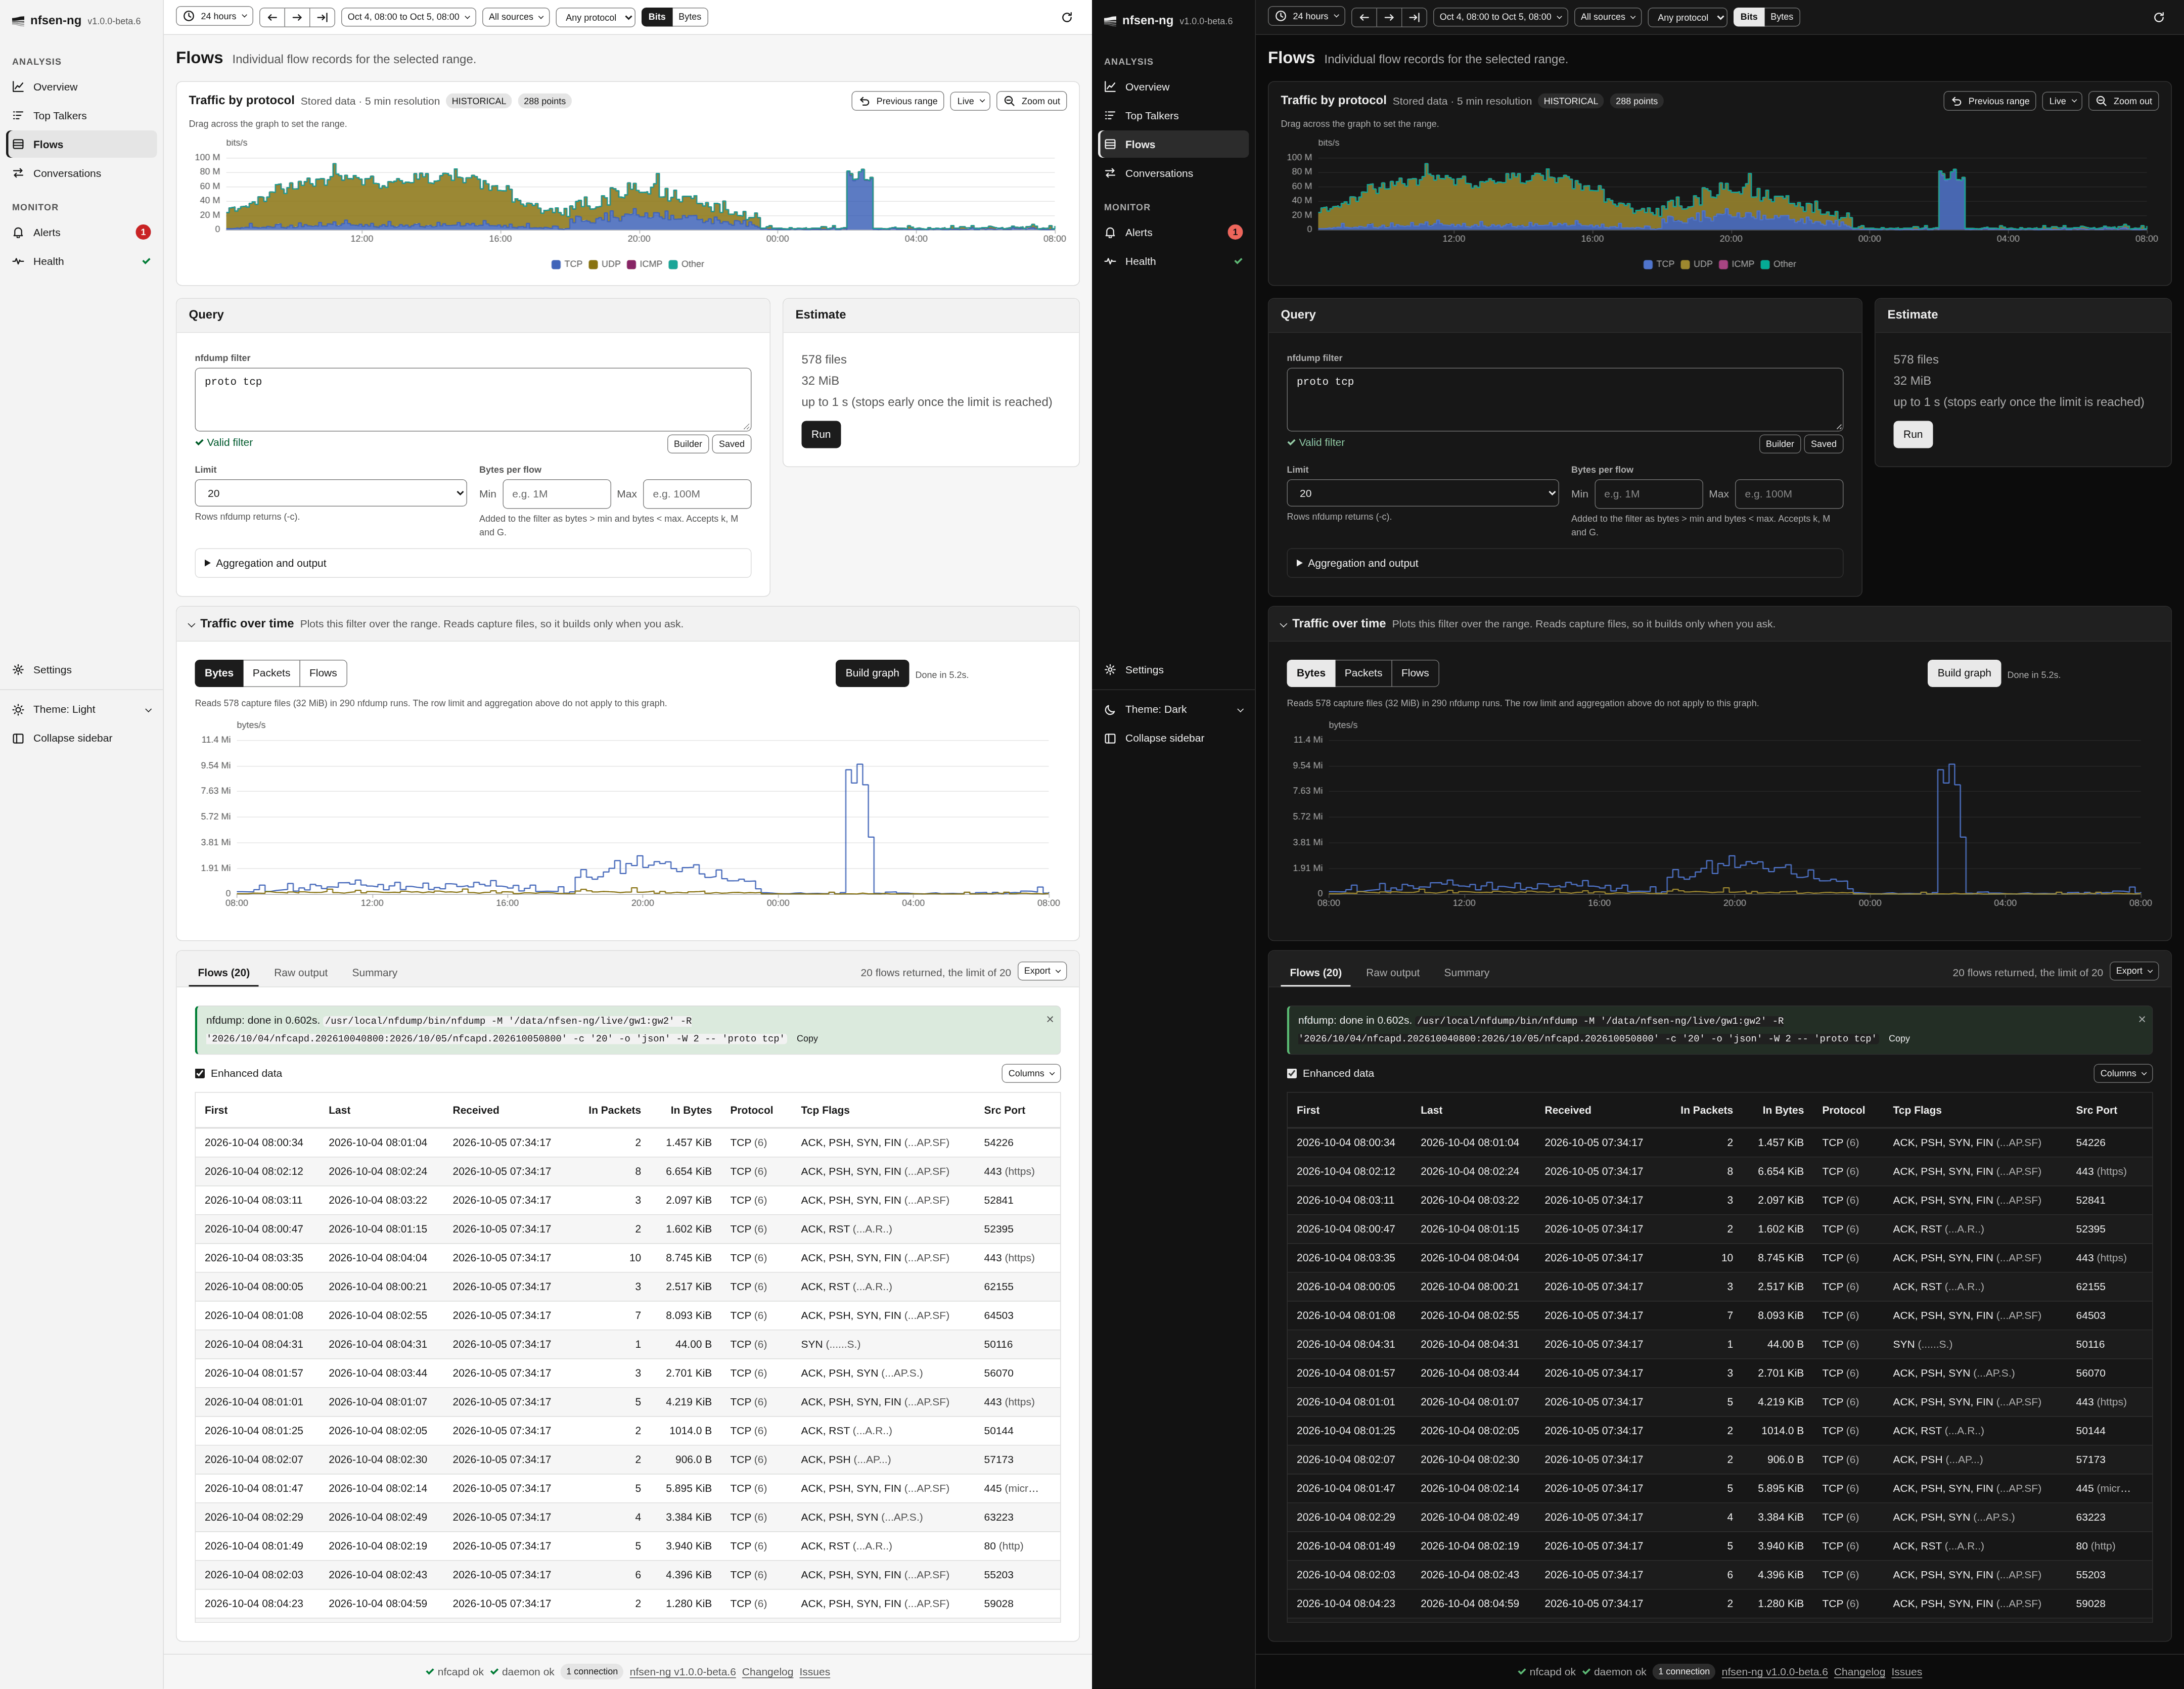
It answers “when did this happen” without describing the query twice. The graph uses the filter you typed, including the byte limits, so it shows exactly the traffic the table lists. Pick Bytes, Packets or Flows above it. With several sources selected it draws one line per source, otherwise one per protocol.
Two things it states on screen. The row limit and the aggregation do not apply to it, because they truncate and regroup the table rather than change which records match, so a table of 100 rows can sit beside a graph of every matching byte. And plotting a filter means reading capture files, one nfdump run per interval, so it never builds on its own: the section says what it would read and waits for Build graph. The runs go several at a time where the server allows more than one nfdump process, and Kill stops them all, keeping the intervals that finished.
If the query or the window moves after a build, the section says so and keeps the graph it built.