Statistics
The Statistics tab answers “who are the top N?” — the busiest hosts, ports, or protocols for a given time window, ranked and totalled, rather than a flow-by-flow list.
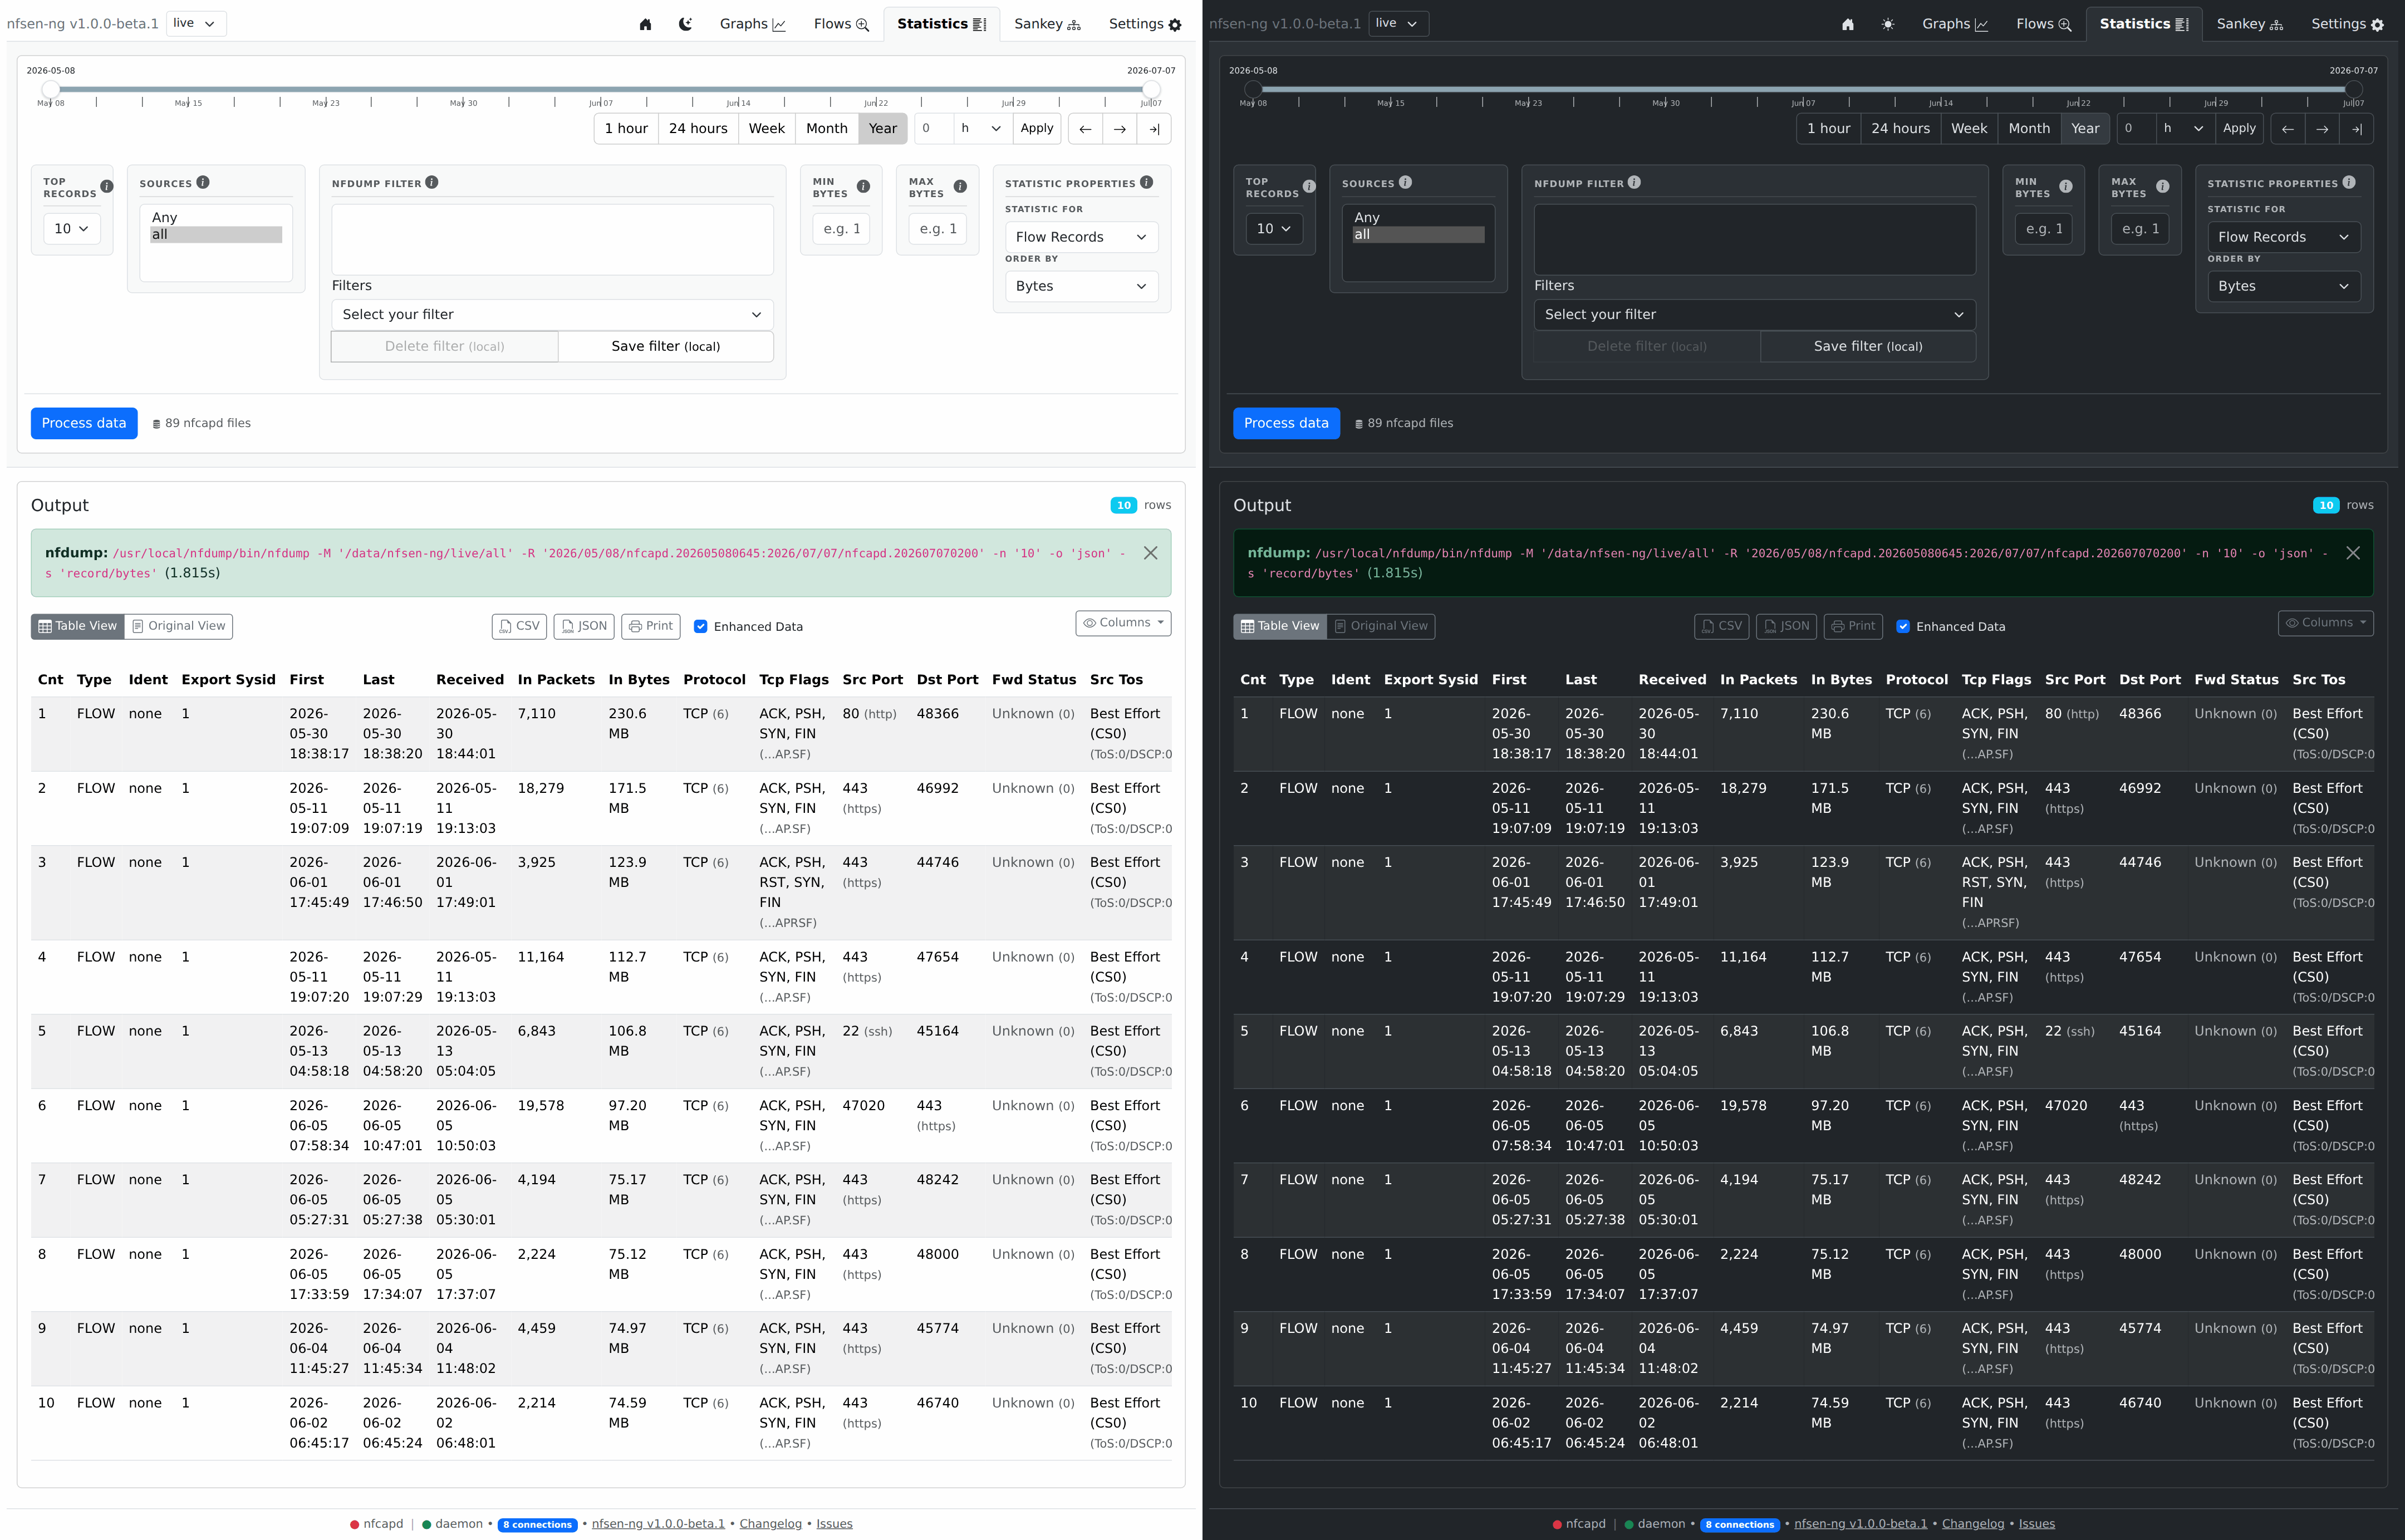
Running a query
Same pattern as Flows: set your filters, click
Process data, and the exact nfdump command used is shown above the
results so you know precisely what was measured.
What can you rank by?
The Statistic for dropdown is the key control — it decides what each row of the results represents:
| Statistic for | Answers |
|---|---|
| Flow Records | Top individual flows |
| Any / Src / Dst IP address | Busiest hosts, overall or by direction |
| Any / Src / Dst port | Busiest ports |
| Any / Src / Dst AS | Busiest autonomous systems (if AS data is present) |
| Any / In / Out interface | Busiest router interfaces |
| Proto | Traffic split by protocol |
| Src / Dst TOS | Traffic split by ToS/DSCP marking |
Combine with Order by (rank by bytes, packets, or flows) and Top records (how many rows to return) to get, say, “top 10 destination IPs by bytes in the last week.”
Same filters as Flows
Sources, nfdump filter, min/max bytes work identically to the Flows tab — anything you can filter there, you can filter here, just aggregated into ranked totals instead of a flat list.
Clicking an IP address in the results opens the same lookup modal as Flows — see Looking Up an IP.