Introduction
nfsen-ng is an in-place replacement for the ageing NfSen web frontend. It sits on top of the existing nfdump tool suite and adds real-time SSE push, a responsive interface, and a choice of RRD or VictoriaMetrics as the storage backend, without changing how nfcapd itself captures traffic.
Who this is for
Anyone already running (or migrating from) NfSen/nfdump to monitor NetFlow traffic: source and destination breakdowns, protocol and port distributions, flow search, who-talks-to-whom, and threshold alerting, all served from the nfcapd files nfdump already writes.
The shape of the app
A sidebar leads to seven pages:
- Overview: the traffic graph with key figures and the busiest addresses, ports and protocols of the range, from data collected during import.
- Top Talkers: exact top-N rankings by any statistic nfdump offers.
- Flows: individual flow records, their raw nfdump output and a summary.
- Conversations: source and destination pairs as a Sankey, a Matrix and a ranked table.
- Alerts: threshold rules and their fired and resolved history.
- Health: the import, capture sources, disks, checks and the recent log.
- Settings: preferences, and how the instance is deployed.
A controls bar on top sets the time range, sources, protocol and unit for all of them, and the traffic graph above every analysis page doubles as the range picker. Anything that reads capture files runs only when you press Run, after showing what it will cost.
Every page has its own address (#/flows), but it’s one route (/) on the
server. The server side is PHP 8.4 running on OpenSwoole
coroutines via a small in-house framework
(php-via), pushing UI updates to the browser
over Server-Sent Events using Datastar. There’s no
separate REST API and no client-side framework build step: the server renders
Twig templates, and Datastar patches the DOM. Time series live in RRD or
VictoriaMetrics; saved filters, alert history and the precomputed top-N live in
an SQLite file next to the preferences.
To get it running, start with Installation and Configuration. The Quick Tour walks through the interface; the Architecture chapter covers how the pieces fit together; and Development covers running it locally.
OpenSwoole’s FreeBSD/other-BSD port is unmaintained (openswoole/ext-openswoole#233), so nfsen-ng currently requires Linux.
Status
This book documents the v1.0.0-beta.5 line and the unreleased changes on top of
it; see the Roadmap for what’s tracked and what’s next, and the
changelog for what
changed.
Installation
nfsen-ng sits on top of an existing nfdump
capture setup: nfcapd writes rotated flow files, and nfsen-ng reads, imports,
and visualises them. It does not capture traffic itself: you need a working
nfcapd (or an equivalent NetFlow/sFlow/IPFIX collector) writing files before
nfsen-ng has anything to show.
Linux only. The backend runs on the OpenSwoole PHP extension, which has no maintained FreeBSD/other-BSD port (openswoole/ext-openswoole#233). Docker images are Linux-only.
Two ways to install: Docker (recommended) or bare-metal. For a local development setup with source-mounted auto-reload, see Getting Started instead.
Option A: Docker
Prerequisites
- Docker and Docker Compose
nfcapdwriting files under a directory you can bind-mount (default/var/nfdump/profiles-data), in the-S 1subdirectory layout (see nfcapd setup below)
Quick start
No clone needed: grab the compose file and edit it:
curl -O https://raw.githubusercontent.com/mbolli/nfsen-ng/master/deploy/docker-compose.yml
At minimum set NFSEN_SOURCES and NFSEN_PORTS, and make sure the bind-mount
and NFSEN_NFDUMP_PROFILES point at your capture directory. For standard setups
the environment variables are all you need, no settings.php. The full list of
variables lives in Configuration.
A Docker deployment needs two persistent volumes (the shipped compose files wire up both; don’t drop either):
- Capture data: the
nfcapdflow-file tree, mounted at/data/nfsen-ng(NFSEN_NFDUMP_PROFILES). This is the directory your collector writes to and nfsen-ng reads; you point it at your existing capture output.- nfsen-ng’s own data: the RRD database, the preferences and alert rules, and the SQLite store
nfsen-ng.sqlite(saved filters, alert history, the Overview top-N), on thenfsen-datanamed volume at/var/lib/nfsen-ng.They’re separate on purpose (the collector owns the capture tree; it grows with traffic and has its own retention). Skipping volume 2 means a container recreation (every image upgrade) wipes your graphs, preferences, saved filters and alerts. See State & persistence.
When you do want a
settings.php(many sources, a bare-metal path layout): copybackend/settings/settings.php.disttobackend/settings/settings.php, edit it, and mount it read-only. It is a deprecated overlay on the environment: any key it omits still falls back to the matchingNFSEN_*variable. See Configuration: Settings file. Note it must assign the global$nfsen_configarray; a file thatreturns an array is silently ignored.
Deployment modes
The app container (nfsen) listens on port 9000 inside the Docker network
only. How you expose it is the choice:
Mode 1: bundled Caddy (simplest public setup)
deploy/docker-compose.yml ships an optional caddy service gated behind the
proxy compose profile. It terminates TLS (automatic HTTPS via Let’s Encrypt,
HTTP/3) and reverse-proxies everything to nfsen:9000.
# Edit deploy/Caddyfile.prod first: replace `yourdomain.com` with your domain.
docker compose -f deploy/docker-compose.yml --profile proxy up -d
Access at https://<your-domain> (ports 80, 443, and 443/udp are published).
Caddy here is a pure reverse proxy. It does not compress responses or serve static files; the app does that itself. php-via serves and Brotli-compresses
/frontend/*from inside OpenSwoole (withStaticDir()/withBrotli()inbackend/app.php). The providedCaddyfile.prodtherefore has noencodedirective on purpose: SSE streams (the live-update channel) must never be compressed or buffered. It also useshandle_errors 5xx { abort }so Datastar’s SSE client reconnects cleanly across a server restart instead of seeing an error page.
Mode 2: behind your own reverse proxy
If you already run Traefik, nginx, or your own Caddy, start only the app:
docker compose -f deploy/docker-compose.yml up -d # just the nfsen service
Point your proxy at http://nfsen:9000 if it shares the Docker network, or
uncomment the ports entry in the compose file to publish 9000 on the host:
# deploy/docker-compose.yml, nfsen service
# ports:
#   - "9000:9000"
Requirements for any fronting proxy:
- Do not compress proxied responses. The app already Brotli/gzip-compresses its own output; double-compression wastes CPU, and compressing the SSE stream breaks live updates. (Only ever compress at the proxy if you strip the app’s compression, which you shouldn’t.)
- Do not buffer. Disable response buffering / set an immediate flush
interval so SSE frames reach the browser as they’re written
(
proxy_buffering off/X-Accel-Buffering: no/flush_interval -1). - Pass 5xx through as a connection abort (or equivalent) so the Datastar SSE client retries on server restart rather than rendering an error page.
- Pass the original
Hostheader on. php-via refuses an action POST whoseOriginnames another host than the request’sHost(403 Forbidden: untrusted origin). Caddy and Traefik keep the header; nginx needsproxy_set_header Host $host;.
Mode 3: hardened production (read-only capture, bundled Caddy)
deploy/docker-compose.prod.yml is a variant that always starts Caddy (no
profile), mounts the capture directory read-only, and keeps RRD files and app
state on the persistent nfsen-data volume (/var/lib/nfsen-ng). It also
bind-mounts an optional (deprecated) backend/settings/settings.php; new setups
can skip that and configure via NFSEN_* variables alone.
Images and tags
Only one image is published: ghcr.io/mbolli/nfsen-ng, built from
deploy/Dockerfile (PHP 8.4 CLI + OpenSwoole + a source-compiled nfdump 1.7.10 +
the rrd, inotify, and brotli extensions; pdo_sqlite ships with the PHP
base image). The Caddy service uses the stock
caddy:latest image; there is no custom Caddy
image to build.
| Tag | Tracks |
|---|---|
latest | newest tagged release (betas included while pre-1.0) |
edge | newest master build |
x.y.z / x.y / x | a specific release, pinnable |
Useful commands
docker compose -f deploy/docker-compose.yml logs -f nfsen   # tail app logs
docker compose -f deploy/docker-compose.yml ps              # container status
Option B: Bare-metal (Ubuntu / Debian)
The Docker image is the reference install; the steps below reproduce it by hand.
nfsen-ng needs PHP 8.4 with the openswoole, inotify, brotli, rrd and
pdo_sqlite extensions, plus an nfdump binary. The SQLite library behind
pdo_sqlite must be 3.33 or later: the top-N rollups use UPDATE ... FROM, so
with an older library the Overview top-N never gets past Collecting. The Health
page’s Storage (SQLite) group shows the version. On a rolling or recent
distribution, also read libcurl 8.20 and OpenSwoole
below: the Docker image pins its libcurl, a bare-metal host does not.
nfcapd setup
nfsen-ng expects nfcapd files in the -S 1 subdirectory layout
(YYYY/MM/DD/). A typical invocation for nfdump ≥ 1.7.x:
nfcapd -w /var/nfdump/profiles-data/live/<source> -z=lz4 -S 1 -p <port> -D
| Flag | Meaning |
|---|---|
-w <path> | Output directory. Must be <profiles-data>/<profile>/<source> (e.g. .../live/gw1). |
-z=lz4 | Compress capture files (also =lzo, =zstd). The legacy bare -z was removed in nfdump 1.8.x; use the explicit =<algo> form. |
-S 1 | YYYY/MM/DD/ subdirectory structure. Required for nfsen-ng to locate files. |
-p <port> | UDP listen port (e.g. 9995). |
-D | Daemonize. |
Timezone:
nfcapdnames files from the host’s local time. If nfsen-ng then runs in a container atTZ=UTC, setNFCAPD_TZto the capture host’s timezone (e.g.Europe/Berlin) so filenames parse to the correct epoch; otherwise RRD timestamps and chart labels are off by the UTC offset. See Configuration.
The ready-to-use deploy/systemd/nfcapd.service unit already uses
-z=lz4 -S 1. Its ExecStart has to name the nfcapd you want to run. It
names /usr/bin/nfcapd, where a distribution package installs it; with the
source build above, the systemd step below points it at
/usr/local/nfdump/bin.
Install the stack
The PHP repository. Sury serves
jammy,noble,resolute,bullseye,bookwormandtrixie, so thelsb_release -scline below covers Debian and Ubuntu alike.ppa:ondrej/phpis being merged intopackages.sury.organd builds only for Jammy (22.04) and Noble (24.04); Ubuntu 26.04 has no PPA build, and on 22.04/24.04 the PPA still works if you already use it.
# As root.

# --- PHP 8.4 repository (Sury, Debian and Ubuntu alike) ---
apt install -y apt-transport-https lsb-release ca-certificates curl gpg
echo "deb https://packages.sury.org/php/ $(lsb_release -sc) main" > /etc/apt/sources.list.d/php.list
curl -fsSL https://packages.sury.org/php/apt.gpg | gpg --dearmor > /etc/apt/trusted.gpg.d/sury-php.gpg
apt update

# --- Packages ---
apt install -y git pkg-config brotli \
    php8.4 php8.4-dev php8.4-xml php8.4-mbstring php8.4-curl php8.4-sqlite3 \
    rrdtool \
    flex bison libbz2-dev zlib1g-dev build-essential autoconf automake libtool unzip wget

# --- nfdump 1.7.10 from source (matches the Docker image) ---
wget https://github.com/phaag/nfdump/archive/refs/tags/v1.7.10.zip
unzip v1.7.10.zip && cd nfdump-1.7.10
./autogen.sh && ./configure --prefix=/usr/local/nfdump && make && make install && ldconfig
cd ..
# binary is now /usr/local/nfdump/bin/nfdump

# --- PHP extensions ---
# Sury packages three of the four, and enables them on install:
apt install -y php8.4-openswoole php8.4-inotify php8.4-rrd
# brotli has no Sury package: build ext-brotli
# (https://github.com/kjdev/php-ext-brotli), then:
echo "extension=brotli.so" > /etc/php/8.4/mods-available/brotli.ini
phpenmod brotli mbstring curl xml pdo_sqlite

# --- nfsen-ng ---
cd /var/www
git clone https://github.com/mbolli/nfsen-ng
chown -R www-data:www-data nfsen-ng
cd nfsen-ng

# Composer (https://getcomposer.org/download/):
php composer.phar install --no-dev --optimize-autoloader

# Optional (deprecated) settings file, or set the same NFSEN_* env vars instead,
# e.g. via a systemd EnvironmentFile:
cp backend/settings/settings.php.dist backend/settings/settings.php
$EDITOR backend/settings/settings.php   # set sources, ports, nfdump.binary, profiles-data

# Start the HTTP server (listens on port 9000), with the images' memory limit:
sudo -u www-data php -d memory_limit=512M backend/app.php
Which nfdump. nfsen-ng needs nfdump 1.7.2 or later, and the Health page warns below 1.7.10. Release 1.7.9 fixed remotely triggerable crashes in the collectors (IPFIX and NetFlow v9 option templates in
nfcapd, the sFlow decoder insfcapd) and out-of-bounds reads in the file parsers. Build 1.7.10: gcc builds of 1.7.8 and 1.7.9 (nfdump’s configure picks-O3) do not pair bidirectional flows, so-b/-Blist each direction as its own row with an empty Out side. The Bi-directional aggregation on Top Talkers and Flows runs-B, and the 1.7.8 in earlier nfsen-ng images has this fault too. Most distribution packages lag behind: Debian 12 ships 1.7.1 and Ubuntu 22.04 ships 1.6.23, both below the minimum. Debian 13 (1.7.5), Ubuntu 24.04 (1.7.3) and Ubuntu 26.04 (1.7.6) run but get the Health warning. Debian testing has 1.7.10.To upgrade an existing source build, rerun the nfdump lines above with the new version number;
make installreplaces the binaries under/usr/local/nfdump. Capture files written by 1.7.8 read unchanged. Restartnfcapd, since most of the fixes are in the collectors, and restart nfsen-ng, which reads the nfdump version once per worker.
Where the extensions come from. Sury builds
php8.4-openswoolefrom the same 26.2.0 release the Docker image uses, with openssl, c-ares, curl and mysqlnd support compiled in, so there is nothing to build by hand and none ofpecl’s six configure prompts to answer.pecl install rrdfails outright on Ubuntu 26.04: rrdtool 1.9.0 changedrrd_fetch()and its siblings to takeconst char **, pecl’s rrd 2.0.4 still passeschar **, and since GCC 14 that mismatch is an error rather than a warning. Sury’sphp8.4-rrdis that same 2.0.4 built against 1.9.0. Ubuntu 24.04 and Debian 13 ship rrdtool 1.7.2, where the PECL build still succeeds.
On a bare-metal install point nfdump.binary (or NFSEN_NFDUMP_BINARY) at
/usr/local/nfdump/bin/nfdump if you compiled it as above. On first start the
database is empty: trigger the first import from the web UI (see
First import).
The server runs every tab in one PHP process, so give it the memory limit the
Docker images use, 512M: the command above and deploy/systemd/nfsen-ng.service
pass -d memory_limit=512M. The CLI php.ini of Debian and Ubuntu usually says
-1, no limit, which also turns off the check that a large Flows listing fits.
See PHP memory limit.
The state directory (NFSEN_STATE_DIR, by default backend/settings) must be
writable by the user the server runs as, because the SQLite store
nfsen-ng.sqlite and its journal live there. The chown above covers the
default location. Without php8.4-sqlite3 the server still starts, but saved
filters, the alert history and the Overview top-N stay unavailable, and the
Health page’s Storage (SQLite) group says so.
Front it with a reverse proxy
The app serves and compresses its own static assets, so a fronting proxy only
needs to terminate TLS and forward everything to port 9000: no static-file root,
no encode. The provided deploy/Caddyfile.prod is a complete example; replace
yourdomain.com, then point Caddy at it. Any proxy must follow the SSE rules in
Mode 2 above (no compression, no
buffering, pass 5xx through).
systemd services
Pre-built units are in deploy/systemd/. They reference /var/www/nfsen-ng and
eth0 as placeholders; sed-replace those for your host.
| File | Purpose |
|---|---|
nfsen-ng-docker.service | Run nfsen-ng via docker compose … --profile proxy up -d (recommended) |
nfsen-ng.service | Run the app directly on bare metal (php -d memory_limit=512M backend/app.php, as www-data) |
nfcapd.service | NetFlow capture daemon (-z=lz4 -S 1) |
softflowd.service | Software NetFlow exporter for testing/dev |
# Docker:
sed -i 's|/var/www/nfsen-ng|/your/path|g' deploy/systemd/nfsen-ng-docker.service
sudo cp deploy/systemd/nfsen-ng-docker.service /etc/systemd/system/
sudo systemctl daemon-reload
sudo systemctl enable --now nfsen-ng-docker.service

# Bare-metal:
sed -i 's|/var/www/nfsen-ng|/your/path|g' deploy/systemd/nfsen-ng.service
sudo cp deploy/systemd/nfsen-ng.service /etc/systemd/system/
sudo systemctl enable --now nfsen-ng.service

# Capture on the same host (edit eth0 first):
sed -i 's/eth0/YOUR_INTERFACE/g' deploy/systemd/softflowd.service
# Only with the source build above; a packaged nfcapd stays at /usr/bin/nfcapd:
sed -i 's|/usr/bin/nfcapd|/usr/local/nfdump/bin/nfcapd|' deploy/systemd/nfcapd.service
sudo cp deploy/systemd/nfcapd.service deploy/systemd/softflowd.service /etc/systemd/system/
sudo systemctl daemon-reload
sudo systemctl enable --now nfcapd.service softflowd.service
Unraid
deploy/unraid/ packages the same single image into two Community Applications
roles (web UI + nfcapd collector) sharing one appdata directory, plus a
docker-compose.unraid.yml for the Compose Manager plugin. See
deploy/unraid/README.md
for the walkthrough. The collector role reuses the app image with
--entrypoint /usr/local/nfdump/bin/nfcapd; the UI’s NFSEN_SOURCES must
include the collector’s source name (both default to flows).
First import
nfsen-ng embeds its import daemon inside the server process; there is no
separate CLI binary. On a fresh install with no data yet, nothing is imported
automatically: open the app, go to the Health page, and click Trigger in
the profile’s row of the Import card. That scans every nfcapd file back to
NFSEN_IMPORT_YEARS and builds the database. Once data exists, each server start
does an incremental gap-fill for the files written while it was offline. See
Health for the page.
libcurl 8.20 and OpenSwoole
OpenSwoole’s native-curl hook segfaults the worker as soon as a curl request
needs a name lookup, with any libcurl from 8.20.0 onwards. libcurl 8.20.0
changed how its threaded resolver drives curl_multi_socket_action
(curl#21558) and OpenSwoole’s
reactor bridge doesn’t cope, so the worker dies on a hostname whether or not
it resolves; a literal IP is fine. Bisected against OpenSwoole 26.2.0:
8.19.0 and earlier are unaffected, 8.20.0 and later are not.
nfsen-ng handles this itself. It reads the running libcurl at startup and switches that one hook off from 8.20.0 up, keeping every other hook, so nothing crashes and stream-based IO stays non-blocking. The cost is that curl calls then block the worker for the duration of the request instead of yielding to other coroutines. Two things in nfsen-ng use curl:
| Affected when the hook is off | |
|---|---|
| VictoriaMetrics queries and writes | every graph render and every import write on a VM install |
| Alert webhook delivery | each webhook, on any datasource |
An RRD install with no webhooks never calls curl at all and is unaffected either way.
To see which libcurl you are on:
php -r 'echo curl_version()["version"], PHP_EOL;'          # bare-metal
docker exec nfsen-ng php -r 'echo curl_version()["version"], PHP_EOL;'
If you are on 8.20.0 or newer and want the non-blocking behaviour back, the only real options today are to run an older libcurl or to wait for an OpenSwoole fix; the hook cannot be made safe from PHP.
Troubleshooting
No data showing
- Verify the file layout:
<profiles-data>/<profile>/<source>/YYYY/MM/DD/nfcapd.* - Confirm the container mount and
NFSEN_NFDUMP_PROFILESpoint at the same tree. - Trigger the first import: Trigger on the Health page.
- Check RRD files were created under
backend/datasources/data/<profile>/.
nfdump warnings: appendix offset error or read() error … Success
These surface as warnings beside a Top Talkers or Flows result when nfdump reads a
truncated nfcapd file, usually one killed mid-write (container restart, OOM,
power loss).
nfdump still processes every other file in the range; nothing already imported is
lost. To find corrupt files:
docker exec nfsen-ng sh -c 'find /data/nfsen-ng/live -name "nfcapd.*" | \
  xargs -P4 -I{} sh -c "nfdump -r {} -c 1 -q 2>&1 | grep -q error && echo {}"'
Delete the listed files; already-imported RRD/VictoriaMetrics data is unaffected.
SSE not connecting
- DevTools, Network tab, filter
_sse: it should show one persistent connection. - Confirm the proxy isn’t buffering or compressing the stream (see the proxy requirements above).
Rebuild all data from scratch
Use Rescan on the Health page. This wipes the selected profile’s datasource and re-imports from the capture files. (There is no force-import environment variable; the rescan is a UI action.)
On VictoriaMetrics the button is Backfill instead, and it deletes nothing: old samples are rewritten in place. See VictoriaMetrics.
Configuration
nfsen-ng is configured through environment variables (NFSEN_*), for Docker
and bare metal alike. Every variable has one default and one validator, defined
once in backend/common/EnvRegistry.php.
A legacy settings.php file is still supported for unusual bare-metal
layouts, but is deprecated. When present it acts as an overlay on top of the
environment: any key it defines wins, and any key it omits falls back to the
matching environment variable (then the built-in default). An active
settings.php is flagged on the Health page.
Invalid values, deprecated variable names, and unknown NFSEN_* variables
(typos) never fail the boot. A bad value falls back to its default and is called
out on the Health page, so misconfiguration is visible instead of silent. The
System tab of Settings lists every variable with the value in effect and
whether it was set or defaulted.
A third layer sits on top:
preferences.json, the settings saved from Settings > General. It overlays the deployment config and wins for the fields that tab owns (UI defaults, the instance theme, display timezone and log level). See Settings; notably, a saved log level overridesNFSEN_LOG_LEVEL.
Environment variables
Sources & data
| Variable | Default | Description |
|---|---|---|
NFSEN_SOURCES | (none) | Comma-separated source names, e.g. gw1,router. |
NFSEN_PORTS | (none) | Comma-separated port numbers to track, e.g. 80,443,22. |
NFSEN_FILTERS | (none) | JSON array of filter presets, e.g. ["proto tcp","dst port 80"]. Each one is added to the saved filters once, marked as a preset. A preset you delete in the filter drawer stays deleted. |
A
settings.phpthat definesgeneral.sources,ports,filters, orprocessoroverrides the matching variable; where the file omits a key, the environment variable is used.
Core
| Variable | Default | Description |
|---|---|---|
NFSEN_STATE_DIR | backend/settings | Directory for mutable runtime state: preferences.json, the alert rule state and the SQLite store nfsen-ng.sqlite (saved filters, alert history, top-N data). It must be writable. The Docker image sets this to /var/lib/nfsen-ng/state (on the persistent volume); see State & persistence. |
NFSEN_SETTINGS_FILE | backend/settings/settings.php | Path to a custom (deprecated) settings file. The default path is used only if the file exists; a path set here must exist, or the server stops at start. |
NFSEN_PREFERENCES_FILE | <state dir>/preferences.json | Override just the preferences file path (normally derived from NFSEN_STATE_DIR). |
NFSEN_DATASOURCE | RRD | Datasource: RRD or VictoriaMetrics. |
NFSEN_PROCESSOR | NfDump | Flow processor. Only NfDump is implemented. |
NFSEN_LOG_LEVEL | INFO | Log verbosity. Accepts DEBUG, INFO, NOTICE, WARNING, ERR/ERROR, CRIT, ALERT, EMERG (and LOG_-prefixed forms). Controls both the app and the Swoole server. |
NFSEN_MCP_HTTP | false | Serve the read-only MCP endpoint at /_mcp on the app’s own port. See MCP Server. |
NFSEN_MCP_HOSTS | (empty) | Hostnames an MCP client may address this server as, comma-separated. Empty means localhost only. |
NFSEN_MAX_STATS_WINDOW | 0 | Longest window, in seconds, that Top Talkers, Conversations, a filtered graph and the exact Overview run read (0 = unlimited). A longer range is shortened to its last part, and the estimate says so. Also general.max_stats_window in settings.php. |
NFSEN_DEFAULT_THEME | auto | Instance theme while Settings > General > Theme is left at Deployment default. auto follows the operating system’s prefers-color-scheme; dark and light force it. A browser that picked its own theme in the sidebar keeps its choice. Also settable as frontend.defaults.theme in settings.php. |
NFSEN_DEV_MODE | false | Enables php-via dev mode (static assets served no-cache). Leave off in production. |
nfdump / nfcapd paths
| Variable | Default | Description |
|---|---|---|
NFSEN_NFDUMP_BINARY | /usr/local/nfdump/bin/nfdump | Path to the nfdump binary. The Docker image compiles nfdump to /usr/local/nfdump/bin. |
NFSEN_NFDUMP_PROFILES | /var/nfdump/profiles-data | Root path to the nfcapd data tree. In Docker this must match the container-side bind-mount (the shipped compose maps it to /data/nfsen-ng). |
NFSEN_NFDUMP_PROFILE | live | Default profile subfolder. See Profiles. |
NFSEN_PORT_DIRECTION | dst | Which side of a flow a per-port graph counts: dst, src, or any for either direction. Set any if your exporter reports one direction of each flow and your port graphs are empty. |
NFSEN_NFDUMP_MAX_PROCESSES | auto | Parallel nfdump processes; each uses about 2 to 3 CPU cores. auto or 0 is a third of the CPU cores, between 2 and 8; any positive number is used as it is. See nfdump processes and CPU cores. |
NFSEN_NFDUMP_WORKERS | 2 | Filter threads per nfdump process, passed to every run as -W (0 to 16). 0 leaves nfdump’s own default of half the host’s cores. |
NFCAPD_TZ | (PHP default TZ) | Timezone nfcapd used when writing filenames. Set this when nfcapd ran on a non-UTC host and nfsen-ng runs at TZ=UTC; otherwise epoch timestamps are off by the UTC offset. E.g. Europe/Berlin. |
TZ | (system) | The container/process timezone. nfsen-ng also compares it against php.ini in a health check. |
nfdump processes and CPU cores
nfdump reads and decompresses each capture file on one thread and aggregates
-s and -A statistics on its main thread, so one nfdump process keeps about 2
to 3 cores busy whatever its thread settings say. nfsen-ng therefore limits
processes, not threads: NFSEN_NFDUMP_MAX_PROCESSES is the number of nfdump runs
that may execute at once. Each run also holds its own aggregation table, about
150 to 200 MB for -s srcip over 24 million flows and more for wide windows and
-A, so the limit bounds memory as well.
auto (the default, also 0) sets the limit to a third of the CPU cores, at
least 2 and at most 8:
| CPU cores | Parallel processes |
|---|---|
| 4 | 2 |
| 8 | 2 |
| 12 | 4 |
| 20 | 6 |
| 24 or more | 8 |
The core count follows container limits. It is the smaller of the CPUs the
process may run on (what nproc prints) and the cgroup CPU quota, rounded up
(cpu.max, or cpu.cfs_quota_us on cgroup v1). A container started with
--cpus=4 on a 20-core host counts 4. Where neither can be read, nfsen-ng
counts the online CPUs. An explicit number is used as it is, so existing
settings keep working.
A settings.php copied from an older template, whose max-processes line reads
(int) (getenv('NFSEN_NFDUMP_MAX_PROCESSES') ?: 1), pins one process when the
variable is unset or 0, because PHP reads '0' as false there. Set the
variable to auto instead, delete the line, or write
getenv('NFSEN_NFDUMP_MAX_PROCESSES') ?: 'auto'. The Parallel processes
row on the Health page says whether auto is in effect.
NFSEN_NFDUMP_WORKERS is passed to every nfdump run as -W. Without it, each
process starts filter threads for half the host’s cores, up to 8, so six
parallel runs could start 48 of them. A second filter thread speeds up a
filtered query by up to about 20%; more make no measurable difference. nfdump
1.7.2 has no -W, so nfsen-ng passes it to 1.7.3 and later only. The filter
check while typing (nfdump -Z) takes neither a slot nor -W.
Every nfdump run takes one slot, and slots come in two classes:
- User queries (Top Talkers, Flows, Conversations, a filtered graph, the exact Overview run, an alert’s Test button) may take every free slot and wait up to 30 seconds for one.
- Background work (the import, the top-N collector and its gap filler, live
alert evaluation) holds at most half the slots, starts only while one more
slot stays free, and waits while any user query waits. It waits up to 10
minutes for a slot, so a long query delays an import instead of dropping a
file. Live alert evaluation is the exception: the import daemon waits for it,
so one evaluation waits at most a minute in total for the slots of all its
filtered rules. A rule still without a slot then is not evaluated for that
interval, and the log says
no free nfdump process.
Background work therefore never holds more than half the slots, and a user
query never queues behind background work: it waits only for a running nfdump
to end. With a limit of 1, a user query waits for at most one background run
that had already started.
One user query may hold several slots. A filtered graph runs as many intervals
at once as there are free slots, and gives one back after each interval to a
user query that waits or to background work that needs one. A large Top Talkers,
Conversations or Overview exact run splits into time slices on up to 8 slots.
Once the limit is 3 or more it leaves one free for another query when 3 or more
are free, and otherwise takes up to 2. It gives each slot back as its slice ends. The top-N collector collects up to half the slots’
worth of capture files at once. With auto on fewer than 12 cores the limit is
2 or 3, so a split runs 2 processes and the collector takes one file at a time.
See Nfdump Integration
for how a split query stays exact.
The nfdump group on the Health page shows the detected cores and where
the number came from, the process limit, the -W in use and the slots in use by
class. Settings > System lists the same under In effect.
Import
| Variable | Default | Description |
|---|---|---|
NFSEN_IMPORT_YEARS | 3 | Years of history to scan on import; also sets the depth of the RRD daily archive. |
NFSEN_SKIP_INITIAL_IMPORT | (off) | Set to 1 or true to skip the startup gap-fill and only set up inotify watches. |
NFSEN_SKIP_DAEMON | (off) | Set to 1 or true to disable the embedded import daemon (and periodic alert evaluation) entirely. |
NFSEN_TOPN_RETENTION_DAYS | 31 | Days of per-interval top-N data kept in SQLite for the Overview tables. 0 turns collection off. See Top-N data. |
Changing
NFSEN_IMPORT_YEARSafter the first import only affects the RRD daily-archive depth, which is fixed at creation time. To resize it, run Rescan on the Health page to recreate the RRD files. Rebuilding is a UI action; there is no import-trigger environment variable.
Top-N data
While importing, nfsen-ng records the top 50 of nine statistics (source and
destination address, source and destination port, protocol, source and
destination AS, input and output interface) for every capture file, and keeps
exact hourly and daily sums of them. The Overview KPI cards and the top-N table
read these lists instead of running nfdump. NFSEN_TOPN_RETENTION_DAYS sets how
many days back they reach; a range that starts earlier is offered as an explicit
Run exact query instead.
Budget about 12 MB per source and day in the state directory: 31 days of one
source come to roughly 180 MB for the per-interval lists and about as much again
for the hourly and daily sums. The variable is read at start. After a restart
with a lower retention, the pruner removes the older days, starting five minutes
in and then hourly; after a raise, the gap filler queues the capture files of the
older days that still exist, 500 at a time and the next ones once the queue is
down to 250, until nothing is missing or a file fails; the collector works
through them on background processes. 0 stops collection, and the Overview table then offers the exact run for
every range. See SQLite store for the schema.
RRD storage
| Variable | Default | Description |
|---|---|---|
NFSEN_RRD_PATH | backend/datasources/data | Where RRD files are stored. The Docker image sets this to /var/lib/nfsen-ng/rrd (on the persistent volume, alongside state); see State & persistence. Override to relocate. |
VictoriaMetrics
| Variable | Default | Description |
|---|---|---|
NFSEN_VM_HOST | victoriametrics | VictoriaMetrics hostname. (Legacy alias: VM_HOST, still honoured.) |
NFSEN_VM_PORT | 8428 | VictoriaMetrics HTTP port. (Legacy alias: VM_PORT, still honoured.) |
See VictoriaMetrics for the full setup.
NetBox IP lookup
nfsen-ng can enrich private/reserved IPs with metadata from a NetBox IPAM instance. When configured, clicking such an address opens a dialog with its NetBox description, tenant, VRF, role, and status. Only private/reserved ranges are looked up; public IPs get geolocation instead.
| Variable | Default | Description |
|---|---|---|
NFSEN_NETBOX_URL | (empty) | Base URL of your NetBox instance, e.g. https://netbox.example.com. |
NFSEN_NETBOX_TOKEN | (empty) | Read-only NetBox API token. |
Both are also settable as general.netbox_url / general.netbox_token in
settings.php. The integration is disabled while either value is empty.
Settings > Integrations shows whether it is configured, with the token masked.
Local GeoIP database
Public IPs can be geolocated from a local MaxMind database instead of a web service. The lookup then never leaves the host and has no rate limit.
| Variable | Default | Description |
|---|---|---|
NFSEN_GEOIP_DB | (empty) | Path to a MaxMind GeoLite2 or GeoIP2 City or Country .mmdb. When set, IP lookups use it locally instead of the web service below. |
GeoLite2 is free, but MaxMind hands it out only to registered users: create an
account at maxmind.com, generate a
license key, and download GeoLite2-City.mmdb from the account page or keep it
current with MaxMind’s
geoipupdate tool. Then mount the
directory that holds it read-only and point the variable at the file:
# docker-compose.yml, nfsen service
volumes:
  - /usr/share/GeoIP:/usr/share/GeoIP:ro
environment:
  - NFSEN_GEOIP_DB=/usr/share/GeoIP/GeoLite2-City.mmdb
nfsen-ng reads the file with the pure-PHP maxmind-db/reader library (no PHP
extension needed) and reopens it when its modification time changes, so a
geoipupdate run takes effect without a restart. Mount the directory, not the
file: geoipupdate replaces the file with a new one, and a single-file bind
mount keeps showing the container the old one until it is recreated. Settings > Integrations
shows the path, the database type, its build date, and either Active or the
reason it cannot be used (file missing, a directory in the path the process
cannot enter, unreadable file, not an .mmdb). While the file cannot be opened,
lookups fall back to the web service. The IP info dialog names its source:
MaxMind database or the web service’s host.
Geolocation lookup
Without a local database, public IPs are enriched by a geolocation web service, the counterpart to the NetBox lookup above and the only one of the two that talks to a third party. Private and reserved ranges never reach it, so internal addressing stays on your network. The default is ipapi.co, which rate-limits anonymous callers: point this at another provider, or at the same one with an API token, when you hit that limit.
| Variable | Default | Description |
|---|---|---|
NFSEN_IPINFO_URL | https://ipapi.co/{ip}/json/ | Geolocation endpoint. {ip} is replaced with the URL-encoded address (a template without it gets the address appended), {token} with NFSEN_IPINFO_TOKEN. |
NFSEN_IPINFO_TOKEN | (empty) | API key for that service. Only sent where the URL puts {token}. |
The quickest fix if you’re only occasionally rate-limited is to stay on ipapi.co and register for a key:
NFSEN_IPINFO_URL=https://ipapi.co/{ip}/json/?key={token}
NFSEN_IPINFO_TOKEN=your-key-here
Every service spells its key parameter differently (?key=, ?token=,
?apiKey=), so the URL owns the spelling and the key stays in its own variable,
where it is masked on the Health page and in Settings instead of sitting in a URL
that gets echoed back at you. Putting the key straight into NFSEN_IPINFO_URL
also works; it just forfeits that masking. The Health page flags the two ways the
pair can be set up wrong: a {token} placeholder with no key to fill it, and a
key with no placeholder to land in.
Services that work out of the box
Each of these was checked against nfsen-ng and renders a populated table with a country flag. All but ipinfo.io work without an account.
| Service | NFSEN_IPINFO_URL | Free tier (as advertised) |
|---|---|---|
| ipapi.co (default) | https://ipapi.co/{ip}/json/ | 1 000/day, 30 000/month, no key |
| ip-api.com | http://ip-api.com/json/{ip} | 45/minute, no key; HTTPS is paid-only, hence the http:// |
| ipwho.is | https://ipwho.is/{ip} | 1 000/day, no key |
| freeipapi.com | https://freeipapi.com/api/json/{ip} | 60/minute, no key |
| ipinfo.io | https://ipinfo.io/{ip}/json?token={token} | free token; their free Lite plan is unlimited but country-level only |
Quotas change without notice, so treat the last column as a hint about which service to reach for, not a guarantee. Anything else that answers with a JSON object works too, for example a geolocation service on your own network:
NFSEN_IPINFO_URL=http://geoip.internal.example/{ip}
What the dialog does with the response
The provider decides which fields are shown: nfsen-ng renders whatever JSON comes back, one row per key, so a service returning more detail shows more rows. Only two things are interpreted:
- The country flag uses
country_code, falling back to a two-lettercountryorcountryCode. It is omitted if none of them is present. The flag is an emoji rendered server-side, not an image fetched from a CDN, so nothing in the dialog reaches outside your network except the geolocation call itself. Its tooltip uses the country name, taken from whichever ofcountry_name,countryorcountryNamethe provider filled in. - Errors are shown as a message instead of an empty table. Recognised
conventions are a truthy
error(flat or nested{"error": {"title", "message"}}),success: false,status: "fail", and any 4xx/5xx status. This is what surfacesRateLimitedwhen a quota runs out, rather than leaving you guessing.
Nested values (ipwho.is’s connection, for instance) are rendered as JSON.
Reverse DNS
The IP info dialog also asks DNS for the host name of the address. Turn that off
under Settings > Integrations > Reverse DNS when the DNS server should not see
these lookups or answers slowly; the dialog then says the name was not looked up.
The switch is saved in preferences.json; there is no environment variable for it.
Alert email
| Variable | Default | Description |
|---|---|---|
NFSEN_ALERT_EMAIL_FROM | (empty) | From-address for alert emails. Setting it enables the email alert channel; leaving it empty disables email delivery. Also settable as general.alert_email_from. |
OpenSwoole server
| Variable | Default | Description |
|---|---|---|
SWOOLE_WORKER_NUM | 1 | Worker processes. Leave it at 1. php-via 0.13 can serve a tab from any worker, but nfsen-ng keeps its nfdump slots, running queries, filtered-graph cache and the server-owned tab signals (such as whether a query runs) in each worker’s memory, so a Kill or a finished query could reach a worker that does not know the query. The inotify poll and the top-N collector’s timer run on the first worker only, but every worker would run the start-up catch-up import against the same files and SQLite store. |
SWOOLE_MAX_REQUEST | 0 | Requests per worker before restart. 0 (unlimited) is correct for a long-lived SSE server. |
SWOOLE_MAX_COROUTINE | 10000 | Max concurrent coroutines / SSE connections. |
PHP memory limit
One worker serves every browser tab, so its memory_limit is the memory of the
whole instance: when it runs out, every open session ends at once and the
restarted server begins with a catch-up import. The Docker images set
memory_limit = 512M, and deploy/systemd/nfsen-ng.service starts the server
with php -d memory_limit=512M. On bare metal without that unit, set the same:
a Debian or Ubuntu CLI php.ini usually says -1, no limit at all, which also
turns off the check that a Flows listing above 1,000 rows fits before it runs.
Each nfdump process has its own memory on top, outside PHP: about 150 to 200 MB
for -s srcip over 24 million flows.
State & persistence
All of nfsen-ng’s own persistent data lives under one directory,
/var/lib/nfsen-ng, in two subdirectories:
| Path | Contents |
|---|---|
rrd/ (NFSEN_RRD_PATH) | RRD database files (unused for the VictoriaMetrics datasource) |
state/ (NFSEN_STATE_DIR) | preferences.json (preferences and alert rule definitions), alerts-state.json (which rules are firing, cooldowns), and nfsen-ng.sqlite with its -wal/-shm companions (saved filters, alert history, recorded query timings, per-interval top-N data) |
This is deliberately separate from the nfcapd capture tree (/data/nfsen-ng),
which the collector owns and which is usually managed on its own retention schedule.
In Docker this must live on a volume, or a container recreation (every image upgrade) wipes your RRD graphs, preferences, saved filters and alerts:
- The image defaults
NFSEN_RRD_PATHandNFSEN_STATE_DIRinto/var/lib/nfsen-ngand declares it aVOLUME, so even a baredocker runpersists in an anonymous volume. - The shipped compose files map a named volume there (
nfsen-data), which also survivesdocker compose downand is easy to back up. Unraid mounts/mnt/user/appdata/nfsen-ng-data. - Dev (bind-mounted source) and bare-metal keep the built-in defaults
(
backend/datasources/dataandbackend/settings), next to the code.
The state directory has to be writable by the user nfsen-ng runs as: SQLite
writes its journal next to the database file. When it is not, or when the
pdo_sqlite driver is missing, the app still starts. Saved filters, the alert
history and the Overview top-N then show as unavailable with the reason, and the
Storage (SQLite) group on the Health page says what to fix.
To back up or migrate an instance, stop the app and copy /var/lib/nfsen-ng. That
single directory holds your graphs, your configuration and your saved filters. A
copy of the running app can catch the SQLite database mid-write; to back the
database up live, see SQLite Store.
Settings file (deprecated)
Deprecated. File-based config predates the environment-variable model and is kept only for backward compatibility. New installs should use
NFSEN_*variables; an activesettings.phpis flagged on the Health page and may be removed in a future major release.
For a bare-metal path layout, copy the template and edit it:
cp backend/settings/settings.php.dist backend/settings/settings.php
The file must assign the global $nfsen_config array: nfsen-ng includes
it and reads that global. A file that returns an array (or defines any other
variable) is silently ignored and you get empty settings. The file is an overlay
on the environment: any key you set wins, and any key you omit falls back to the
matching NFSEN_* variable, then the built-in default.
<?php
$nfsen_config = [
    'general' => [
        'sources' => ['gw1', 'router'],   // nfcapd source names
        'ports'   => [80, 443, 22],        // ports to track in RRD
        'filters' => ['proto tcp', 'dst port 80'], // presets for the saved filters
        'db'      => 'RRD',                // 'RRD' or 'VictoriaMetrics'
        'processor' => 'NfDump',
        'max_stats_window' => 0,           // seconds; 0 = unlimited
        'netbox_url'   => '',
        'netbox_token' => '',
    ],
    'nfdump' => [
        'binary'        => '/usr/local/nfdump/bin/nfdump',
        'profiles-data' => '/var/nfdump/profiles-data',
        'profile'       => 'live',
        'max-processes' => 'auto',         // or a number of parallel nfdump processes
        'workers'       => 2,              // -W per nfdump run; 0 = nfdump's default
    ],
    'db' => [
        'RRD'            => ['data_path' => null, 'import_years' => 3],
        'VictoriaMetrics'=> ['host' => 'victoriametrics', 'port' => 8428, 'import_years' => 3],
    ],
    'log' => ['priority' => \LOG_INFO],
];
Key reference (the template ships more, including frontend.defaults.* UI
defaults):
| Key | Meaning | Default in template |
|---|---|---|
general.sources | nfcapd source names (string[]) | ['source1','source2'] |
general.ports | Ports to track (int[]) | [80, 22, 53] |
general.filters | Filter presets, added once to the saved filters (string[]) | a starter set |
general.db | Datasource class name | getenv('NFSEN_DATASOURCE') ?: 'RRD' |
general.processor | Flow processor | 'NfDump' |
general.max_stats_window | Query window cap in seconds (0 = unlimited) | 0 |
general.netbox_url / general.netbox_token | NetBox lookup | empty |
general.alert_email_from | Alert email From-address | (not in template) |
nfdump.binary | nfdump path | NFSEN_NFDUMP_BINARY, else /usr/bin/nfdump |
nfdump.profiles-data | Capture data root | /var/nfdump/profiles-data |
nfdump.profile | Default profile | live |
nfdump.max-processes | Parallel nfdump processes: 'auto', 0 or a number | NFSEN_NFDUMP_MAX_PROCESSES, else 'auto' |
nfdump.workers | -W per nfdump run (0 to 16) | NFSEN_NFDUMP_WORKERS, else 2 |
db.RRD.data_path | RRD storage dir (null = default) | null |
db.<datasource>.import_years | Years to import/retain | 3 |
log.priority | Syslog level constant | \LOG_INFO |
Note the key spelling:
nfdump.profiles-dataandnfdump.max-processesuse dashes;general.max_stats_window,general.netbox_url, andgeneral.netbox_tokenuse underscores.import_yearsis read from under the sub-key that matchesgeneral.db(e.g.db.RRD.import_years).
The top-N retention and the GeoIP database have no settings.php key; set them
through their environment variables.
Timezones
nfcapd names files using the local time of the host running it. nfsen-ng parses
those filenames back to epochs to place data on the timeline. If the two run in
different timezones (classic case: bare-metal nfcapd in CEST, nfsen-ng in a
TZ=UTC container), set NFCAPD_TZ to the capture host’s IANA timezone. When
unset, nfsen-ng falls back to PHP’s effective timezone. Getting this wrong
shifts every RRD timestamp and chart label by the UTC offset. The nfcapd file
time check on the Health page warns when the newest file’s name is more than
30 minutes away from the time it was written, which is what a wrong NFCAPD_TZ
looks like.
RRD data retention
RRD files are independent of
nfcapdfiles. Deleting old capture files does not touch RRD graphs, and vice versa. See Data Sources for the conceptual split.
nfsen-ng creates one fixed-size .rrd file per source (and per tracked port).
The size is set at creation and never grows. Each file holds four resolutions
(each stored as both an AVERAGE and a MAX archive):
| Resolution | Retention |
|---|---|
| 5-minute samples | 45 days |
| 30-minute samples | 90 days |
| 2-hour samples | 1 year |
| 1-day samples | NFSEN_IMPORT_YEARS years (default 3) |
Only the daily archive’s depth changes with NFSEN_IMPORT_YEARS; the finer
three are fixed.
Disk space
Because the fine-resolution archives dominate and are fixed, every .rrd file
is roughly the same size, about 5 MiB, whether it’s an aggregate or a
per-port file, and almost independent of NFSEN_IMPORT_YEARS (the daily archive
is a small fraction of the total). Budget accordingly:
- ~5 MiB per source (aggregate)
- ~5 MiB per tracked port, per source
So 10 sources × 5 tracked ports ≈ 60 files ≈ ~300 MB total. This is a flat, predictable cost: RRD files are circular buffers that never grow with traffic volume. The SQLite store in the state directory comes on top; see Top-N data.
Changing retention depth
To store more (or fewer) years of daily data, set NFSEN_IMPORT_YEARS and then
recreate the RRD structure with Rescan on the Health page (the server
also logs a warning on start if it detects a size mismatch):
# docker-compose.yml
environment:
  - NFSEN_IMPORT_YEARS=5   # 5 years of daily graph data
  # then run Rescan once from the Health page to rebuild the RRD files
RRD vs nfcapd files
RRD (.rrd) | nfcapd (nfcapd.*) | |
|---|---|---|
| Purpose | Graph counters (flows/packets/bytes) | Raw flow records for Top Talkers, Flows and Conversations |
| Size | Fixed (~5 MiB/file) | Grows with traffic |
| Removed with nfcapd files? | No, independent | n/a |
| Queries work without them? | n/a | No, nfdump reads them directly |
| Retention control | NFSEN_IMPORT_YEARS | Manage separately (e.g. cron + find -mtime) |
nfdump Profiles
nfsen-ng supports multiple nfdump profiles (e.g. live, test, backup). Each
profile is an independent tree of nfcapd capture files under
nfdump.profiles-data, with its own separate RRD (or VictoriaMetrics) dataset.
The conceptual model is covered in
Data Sources: Profiles; this page is
the operational side.
Directory layout
<profiles-data>/
├── live/
│   └── <source>/
│       └── YYYY/MM/DD/nfcapd.YYYYMMDDHHMM
└── test/
    └── <source>/
        └── YYYY/MM/DD/nfcapd.YYYYMMDDHHMM
Profiles are detected automatically: Config::detectProfiles() scans
<profiles-data> and treats each top-level directory that contains a
source → YYYY/ tree as a profile. A directory that instead holds sub-groups
of such trees becomes a nested group/child profile. The nfdump.profile
setting (NFSEN_NFDUMP_PROFILE, default live) only picks the default profile
shown on load. If the data root is missing or empty, nfsen-ng falls back to a
single profile named after nfdump.profile.
Configuration
No extra configuration is required: detection is automatic on startup. To run a
second collector writing into another profile, just point its -w at a different
top-level directory:
# Live collector: port 9995 → profiles-data/live/all/
nfcapd -w /var/nfdump/profiles-data/live/all -z=lz4 -S 1 -p 9995 -D

# Test/secondary collector: port 9996 → profiles-data/test/all/
nfcapd -w /var/nfdump/profiles-data/test/all -z=lz4 -S 1 -p 9996 -D
Docker Compose example
nfcapd-test:
  image: ghcr.io/mbolli/nfsen-ng:latest
  entrypoint: ["/usr/local/nfdump/bin/nfcapd"]
  command: ["-w", "/data/nfsen-ng/test/all", "-z=lz4", "-S", "1", "-p", "9996"]
  volumes:
    - /var/nfdump/profiles-data:/data/nfsen-ng
  ports:
    - "9996:9996/udp"
Profile selector
When more than one profile is detected, a profile selector appears at the start
of the controls bar; profiles named group/child are grouped. Switching profiles
re-scopes the whole UI to that profile’s data range and slides the visible window
to the end of its available data; the choice is persisted to preferences.json
so it survives a reload.
Import daemon
The embedded import daemon watches each detected profile independently. The Import card on the Health page shows a row per profile, and the footer daemon indicator’s tooltip says how many profiles and directories are being watched. Each profile:
- watches its own
<profiles-data>/<profile>/subtree via inotify; - writes into profile-namespaced storage (
data/<profile>/<source>.rrd, or aprofile=label for VictoriaMetrics); - decides on startup whether to gap-fill based on its own last-update timestamp. A profile with no data yet is skipped: trigger its first import manually with the per-row Trigger button.
Storage layout
RRD files are stored per profile:
backend/datasources/data/<profile>/<source>.rrd
backend/datasources/data/<profile>/<source>_<port>.rrd
backend/datasources/data/<profile>/<port>.rrd        # port-only aggregate
A .rrd.first sidecar (e.g. all.rrd.first) records the Unix timestamp of the
first real data point, so the range controls start at the true beginning of
available data rather than the RRD creation time.
Rescan is per profile. The Rescan action reads the targeted profile
(admin_target_profile) and resets only that profile’s datasource, leaving the
others untouched.
For VictoriaMetrics the profile is a Prometheus label (profile="live").
Historical data written before profiles existed has no label and is still matched
via a regex selector (profile=~"live|") for backward compatibility.
Health checks
The Health page reports per-profile status: nfcapd path existence and capture
freshness, daemon status and last auto-import, datasource freshness, and one row
per profile and source in the Capture sources card. With a single profile the
check ids and labels stay flat (rrd_data_<source>); with more than one they’re
profile-suffixed (rrd_data_<profile>_<source>) so the two don’t collide. See
Health.
The Overview top-N lists and alert rules are per profile as well: the collector stores each profile’s intervals under its own name, and a rule watches the profile it names.
VictoriaMetrics
VictoriaMetrics is an optional alternative to the default RRD datasource, useful when you want parallel/out-of-order imports, longer retention, or PromQL/MetricsQL for ad-hoc queries. The architectural comparison is in Data Sources; this page is the setup guide.
Trade-offs vs RRD
| RRD | VictoriaMetrics | |
|---|---|---|
| Extra infrastructure | none (a PHP extension) | a separate VM service |
| Disk footprint | fixed ~5 MiB per source/port file | grows with retention (typically tens of MB+) |
| Parallel / out-of-order writes | no | yes |
| Query language | RRDtool | MetricsQL (PromQL-compatible) |
| HTTP query API | no | yes |
| Setup | simple | moderate |
Because every query and write is an HTTP call, a VictoriaMetrics install is the one most affected by the OpenSwoole/libcurl issue described in libcurl 8.20 and OpenSwoole: on libcurl 8.20.0 or newer those calls block the worker rather than yielding. RRD makes no HTTP calls at all.
Setup
1. Start VictoriaMetrics
deploy/docker-compose.victoriametrics.yml brings up a full stack
(victoriametrics, nfsen, and caddy) with the app already pointed at VM:
docker compose -f deploy/docker-compose.victoriametrics.yml up -d
VM listens on 8428; the UI is fronted by Caddy. To add VM to an existing
deployment instead, run a victoriametrics/victoria-metrics container reachable
from the app and set the variables below.
2. Point nfsen-ng at it
Via environment variables (recommended):
| Variable | Default | Description |
|---|---|---|
NFSEN_DATASOURCE | RRD | Set to VictoriaMetrics to activate. |
NFSEN_VM_HOST | victoriametrics | VictoriaMetrics hostname. (Legacy alias: VM_HOST.) |
NFSEN_VM_PORT | 8428 | VictoriaMetrics HTTP port. (Legacy alias: VM_PORT.) |
NFSEN_IMPORT_YEARS | 3 | Lookback window for import and boundary queries. |
Or with a settings file (backend/settings/settings.victoriametrics.dist is a
ready template). Remember the file must assign the global $nfsen_config array,
not return one:
<?php
$nfsen_config = [
    'general' => [
        'sources' => ['gw1', 'router'],
        'ports'   => [80, 443, 22],
        'db'      => 'VictoriaMetrics',
    ],
    'db' => [
        'VictoriaMetrics' => [
            'host' => 'victoriametrics',
            'port' => 8428,
            'import_years' => 3,
        ],
    ],
    // ... nfdump paths, log, etc.
];
3. Import
On a fresh install, run the first import with Trigger on the Health
page. nfcapd files are still required: VictoriaMetrics is a storage backend,
not a replacement for the raw captures nfdump reads for Top Talkers, Flows and
Conversations. The saved filters, the alert history and the Overview top-N live
in the SQLite store in the state directory, whichever datasource you use.
Importing captures older than the install
A normal Trigger resumes at the newest sample already stored and never looks
behind it, so an archive of nfcapd files collected before nfsen-ng was
installed is skipped. Use Backfill on the Health page, which re-reads every
capture file and writes each sample at the timestamp it belongs to. Nothing is
deleted, so it is safe to run on a populated instance, and it can be cancelled.
One prerequisite: VictoriaMetrics silently drops samples older than its
retention window on ingest, without an error. Set --retentionPeriod to cover
your oldest capture before backfilling. The bundled
deploy/docker-compose.victoriametrics.yml sets 3y to match
NFSEN_IMPORT_YEARS, but the default on a stock VictoriaMetrics is one month,
which will make a backfill look like it did nothing.
Data model
nfsen-ng writes Prometheus-exposition samples to
http://<host>:<port>/api/v1/import/prometheus (millisecond timestamps) and
queries them back through VM’s HTTP API (/api/v1/query,
/api/v1/query_range, tfirst_over_time/tlast_over_time).
Metric names are nfsen_<type> for type in flows, packets, bytes, with a
protocol suffix for the per-protocol series:
nfsen_flows{source="gw",profile="live"}                 12345   # aggregate (no port label)
nfsen_flows{source="gw",port="80",profile="live"}       4321    # port-specific
nfsen_flows_tcp{source="gw",protocol="tcp",profile="live"} 8000 # TCP only
nfsen_bytes{source="gw",profile="live"}                 9876543
nfsen_packets{source="gw",profile="live"}               67890
Labels:
source: the source name.port: port number string; absent on aggregate totals. On the read path the aggregate is selected withport="", which matches series where the label is absent (so sparse per-port series don’t shadow the dense aggregate).protocol:tcp/udp/icmp/otheron the per-protocol series (redundant with the metric-name suffix); absent on the aggregate.profile: the nfdump profile, e.g.profile="live". Data written before profiles existed has no label and is matched on read viaprofile=~"live|".
Real-time updates
RRD relies on inotify to detect new files directly. With VictoriaMetrics, a
remote database, the embedded import daemon instead broadcasts a re-render to
all SSE clients after each successful write, and a VictoriaMetricsWatcher polls
VM’s health/readiness so the Health page can report connectivity rather than just
config sanity.
Migrating between RRD and VictoriaMetrics
- Change
general.db(orNFSEN_DATASOURCE) to the target datasource. - Run Backfill (VictoriaMetrics) or Rescan (RRD) to populate it from the
nfcapdfiles. - The two datasources are independent: switching to VM does not touch existing
.rrdfiles, and you can roll back by setting the datasource toRRDagain. Remove the now-unusedbackend/datasources/data/*.rrdonly after verifying the VM data is complete.
Seeding demo / development data
scripts/seed_vm_data.php pushes realistic synthetic NetFlow data into VM, handy
for demos, screenshots, and testing without a live nfcapd source. (The RRD
equivalent is scripts/seed_rrd_data.php.)
php scripts/seed_vm_data.php [--host=localhost] [--port=8428] [--source=all] [--days=90] [--ports=80,443]
| Option | Default | Description |
|---|---|---|
--host | NFSEN_VM_HOST env (or legacy VM_HOST), else localhost | VictoriaMetrics hostname |
--port | NFSEN_VM_PORT env (or legacy VM_PORT), else 8428 | VictoriaMetrics port |
--source | all | source= label value |
--days | 90 | Days of history to generate |
--ports | (none) | Comma-separated ports to also emit, e.g. 80,443,22 |
It generates diurnal traffic with a realistic protocol mix (TCP 63 % / UDP 22 % /
ICMP 4 % / Other 11 %), weekend dips (~30 % quieter), and ±15 % Gaussian noise,
peaking around 25 000 flow events per 5-minute slot at the busiest hour, using
the same metric names and labels VictoriaMetrics::write() produces, so the
output shows up immediately in the graphs. Unlike the RRD seeder (which needs the
app’s config and an RRD datasource, so it runs inside the container), this script
only needs PHP and network reach to VM.
Warning: only run this against a development or demo VictoriaMetrics instance: it writes a large volume of fake flow events.
Upgrading
Upgrading from 1.0.0-beta.5
This release rebuilds the interface around a sidebar and adds an SQLite store next to the RRD or VictoriaMetrics data. Nothing is re-imported and no setting has to change, but bare-metal installs need one more PHP extension and a memory limit for the server, and should run nfdump 1.7.10 (the Health page warns below it).
Docker
Pull the new image and recreate the container. Everything the upgrade creates lands
in the state directory on the nfsen-data volume (/var/lib/nfsen-ng/state), next
to preferences.json. The image already contains pdo_sqlite, nfdump 1.7.10 (it
had 1.7.8) and the server’s memory_limit of 512M. If the collector runs from the
same image (the Unraid template, nfcapd services in a compose file), recreate it
too: most of nfdump 1.7.9’s security fixes are in nfcapd. Capture files written
by 1.7.8 read unchanged.
Bare metal
-
Install and enable the SQLite driver:
apt install php8.4-sqlite3 && phpenmod pdo_sqliteThe app starts without it, but saved filters, the alert history and the Overview top-N stay unavailable until it is there, and the Health page says so. The SQLite library has to be 3.33 or later, or the Overview top-N never gets past Collecting.
-
Update the code and the dependencies.
composer installbrings in the newmaxmind-db/readerpackage:git pull php composer.phar install --no-dev --optimize-autoloader -
Build nfdump 1.7.10 as the installation page shows, point
nfcapd.serviceat/usr/local/nfdump/bin/nfcapdif you run the source build, and restartnfcapd. The Health page warns below 1.7.10. -
Give the server a memory limit: copy the new
deploy/systemd/nfsen-ng.service, which starts it withphp -d memory_limit=512M, or setmemory_limit = 512Min the CLI configuration. See PHP memory limit. -
Make sure the state directory (
NFSEN_STATE_DIR, by defaultbackend/settings) is writable by the user the server runs as, then restart the service.
What happens on the first start
- The SQLite store
nfsen-ng.sqliteis created in the state directory. - The alert history moves into it: every entry of
alerts-log.jsonbecomes a fired event, and the file is renamed toalerts-log.json.migrated. If the move fails, the file stays where it is and the next start tries again. - The filter presets saved in Settings (the old Filter presets list in
preferences.json) become saved filters, once, the first time the server reads the saved filters (when somebody opens the filter builder, for instance). The deployment presets fromNFSEN_FILTERSorsettings.phpare added at the same moment, each one once; a preset you delete stays deleted. - Each browser’s own saved filters, kept by the old filter panel in the browser’s local storage, are imported the first time that browser opens the new version. A failed import is retried on the next load.
- The top-N collector starts recording the Overview lists with the next import, and its gap filler works back through the retention window (31 days by default) from the capture files that still exist. Until the first interval is in, the Overview table says Collecting. Collect missing top-N now on the Health page queues up to 500 missing files right away instead of waiting for the next pass.
- Alert rules with a traffic filter and a % of rolling average threshold start collecting their own baseline: from now on they compare with the filter’s own traffic, recorded at every check, so each has no baseline until it has checked one interval. Their earlier events keep their thresholds, which were per-second averages of all traffic, and the history now labels them as totals per five minutes.
Settings whose default changed
NFSEN_NFDUMP_MAX_PROCESSESisautonow, a third of the CPU cores between 2 and 8; it was 2. A number you set keeps working. Asettings.phpcopied from an older template has'max-processes' => (int) (getenv('NFSEN_NFDUMP_MAX_PROCESSES') ?: 1), which pins one process while the variable is unset or0: set it toauto, delete that line or writegetenv('NFSEN_NFDUMP_MAX_PROCESSES') ?: 'auto'. See nfdump processes and CPU cores.NFSEN_NFDUMP_WORKERSis new: every nfdump run gets-W 2instead of nfdump’s own default, filter threads for half the host’s cores in every process.
What looks different
- Bi-directional on Top Talkers and Flows merges the two directions of a conversation into one row with In and Out filled, where the 1.7.8 of earlier images listed them as separate rows.
- Large Top Talkers, Conversations and Overview exact runs, filtered graphs and the top-N backfill use several nfdump processes where the limit allows; the query status says how many.
What moved in the interface
| In 1.0.0-beta.5 | Now |
|---|---|
| Graphs | Overview page |
| Statistics | Top Talkers page |
| Flows | Flows page |
| Sankey | Conversations page |
| Alerts section of Settings | Alerts page |
| Import and Health sections of Settings | Health page |
| Preferences and System sections of Settings | Settings page (tabs General, Sources, Storage, Integrations, System) |
| Date slider | Controls bar (range menu, step buttons, start and end) and a drag across the traffic graph |
| Filter presets textarea, browser-local filter list | Filter builder drawer with saved filters |
Every page has its own address (#/overview, #/talkers, #/flows,
#/conversations, #/alerts, #/health, #/settings). A browser that last had
a tab open under the old layout opens the matching page, once. The old names work
in the address too: #/graphs, #/statistics, #/sankey and #/investigate
open the page that replaced them.
Upgrading from v0
v1 is a ground-up rewrite. It is not code-compatible with the v0.x
(NfSen-style) releases, but it reuses the same underlying data: nfsen-ng reads
the nfcapd capture files nfdump already writes, so no data migration is
needed. Point v1 at your existing capture tree and run an import.
What changed
Architecture
| v0.x | v1 |
|---|---|
| Apache/nginx + PHP-FPM (per-request) | OpenSwoole via php-via (one persistent process) |
| REST JSON API + AJAX polling | Hypermedia over SSE (Datastar), no JSON API |
| jQuery frontend | Server-rendered Twig + Datastar signals; hash links per page, no client-side framework or build step |
| RRD only | RRD (default) or VictoriaMetrics, plus SQLite for saved filters, alert history and top-N data |
| No live push | inotify → SSE broadcast to every open tab |
See Architecture: Overview for how the v1 pieces fit together.
Frontend
- jQuery, ion.rangeSlider, and the old REST client are gone.
- Replaced by Datastar and Apache ECharts for graphs (v1 migrated the graphs off Dygraphs).
- The server pushes full HTML re-renders over SSE and Datastar morphs the DOM.
Backend
- The entry point is now
backend/app.php(the OpenSwoole server), not a web server document root. - The
cli.phpinterface was removed. Import is driven from the web UI (Trigger, Backfill and Rescan on the Health page) by the daemon embedded inapp.php. - Configuration moved to environment variables (
NFSEN_*); thesettings.phpfile still works but is now a deprecated overlay on top of them. If you keep one, start from the currentbackend/settings/settings.php.distrather than reusing a v0 file verbatim (the schema was expanded and reorganised: newgeneral.db,db.<datasource>.*,frontend.defaults.*, and more), or skip the file entirely and configure via environment variables. See Configuration.
Docker
- v0 ran Apache inside the container; v1 runs the OpenSwoole app and fronts it
with a stock
caddy:latestcontainer (optional, behind theproxyprofile). There is no custom Caddy image. - Deployment layout moved under
deploy/(docker-compose.yml,docker-compose.dev.yml, …). See Installation. - Persistent data is consolidated under a single
nfsen-datavolume at/var/lib/nfsen-ng(rrd/+state/). If you ran an earlier v1 beta with the separaterrd-datavolume (/var/nfsen-ng/rrd), copy your RRD files into the new volume once, e.g.docker run --rm -v rrd-data:/old -v nfsen-data:/new alpine cp -a /old/. /new/rrd/, or rebuild them with Rescan. See State & persistence. - Unraid template users: the UI template gained a matching App data path
(
/var/lib/nfsen-ng, defaulting to/mnt/user/appdata/nfsen-ng-data) in v1.0.0-beta.3. An install created before that has no such mapping, so add it when you update the container, otherwise the RRD database, preferences, saved filters and alert rules are recreated empty on every image update.
Migration steps
-
(Optional) Back up your old RRD files, in case you want to keep the v0 graph history around:
cp -r backend/datasources/data/ /backup/rrd-$(date +%Y%m%d)/ -
Deploy v1. The simplest path is the published Docker image (
ghcr.io/mbolli/nfsen-ng:latest) withdeploy/docker-compose.yml. If you run from source, check out av1.0.0-*release tag (or thev1branch) rather than the old v0 tags. Full steps: Installation. -
Point v1 at your existing capture tree: set
NFSEN_NFDUMP_PROFILES(ornfdump.profiles-data) to the sameprofiles-datadirectorynfcapdalready writes to, and list your sources inNFSEN_SOURCES. -
Review configuration. Map any custom v0 settings onto the current keys or environment variables (Configuration).
-
Build the graph data. Run Trigger on the Health page (or Rescan on RRD, Backfill on VictoriaMetrics) once. This rebuilds the RRD/VictoriaMetrics graph data from your
nfcapdfiles. The v1 RRD structure differs from v0’s, so re-importing from the captures is the reliable path rather than reusing old.rrdfiles. Top Talkers, Flows and Conversations work directly off the capture files and need no import.
Known differences from v0 / NfSen
- The v0 REST API endpoints (
/api/…) no longer exist; v1 has no JSON API. - NfSen’s alert/plugin mechanisms are not carried over; v1 has its own alerting.
- Some v0 profile-filter behaviour differs; v1’s profile model is auto-detected from the capture tree (Profiles).
What is NetFlow?
NetFlow (and its open standard successor, IPFIX) is a way routers and switches summarize the traffic passing through them. Instead of recording every packet, a network device groups packets into flows (one flow per unique combination of source IP, destination IP, source port, destination port, and protocol) and periodically exports a compact record for each flow: how many packets, how many bytes, when it started, when it ended.
A single flow record looks roughly like:
192.168.1.50:52184 → 74.50.105.85:443, TCP, 85 packets, 10.7 KB, lasted 4m48s
That’s all: not the actual content of the traffic (no payload, no URLs, no message bodies), just the shape of the conversation. This is what makes NetFlow practical at scale: a busy link might carry gigabits of traffic per second, but the flow records summarizing it are a tiny fraction of that volume.
What problem does it solve?
Without flow data, answering basic questions about your network requires either expensive full packet capture (storage-hungry, and often legally/privacy sensitive) or nothing at all. With flow export enabled on your routers, you can answer things like:
- “What’s using all our bandwidth right now?” Rank talkers by bytes on Top Talkers.
- “Did anything unusual happen last Tuesday at 3am?” Go back in time, something full packet capture rarely lets you do affordably.
- “Is this subnet talking to that one, and how much?” Conversations answers exactly this, visually.
- “Alert me if ICMP traffic to this network spikes.” See Setting Up Alerts.
Where nfsen-ng fits
nfsen-ng doesn’t capture NetFlow itself; that’s nfcapd’s job (part of the nfdump suite), a small daemon that listens for NetFlow/IPFIX/sFlow packets sent by your routers and writes them to disk in 5-minute-rotated files. nfsen-ng is the web UI on top: it reads those files (via nfdump, the query tool), aggregates them into graphs, lets you search and filter individual flows, and can alert you when traffic crosses a threshold you define.
If you already have nfcapd running and writing files somewhere, nfsen-ng just needs to be pointed at that directory. See Quick Tour to get oriented, or the Developer Reference’s Getting Started page if you’re setting up nfcapd/nfdump for the first time.
Quick Tour
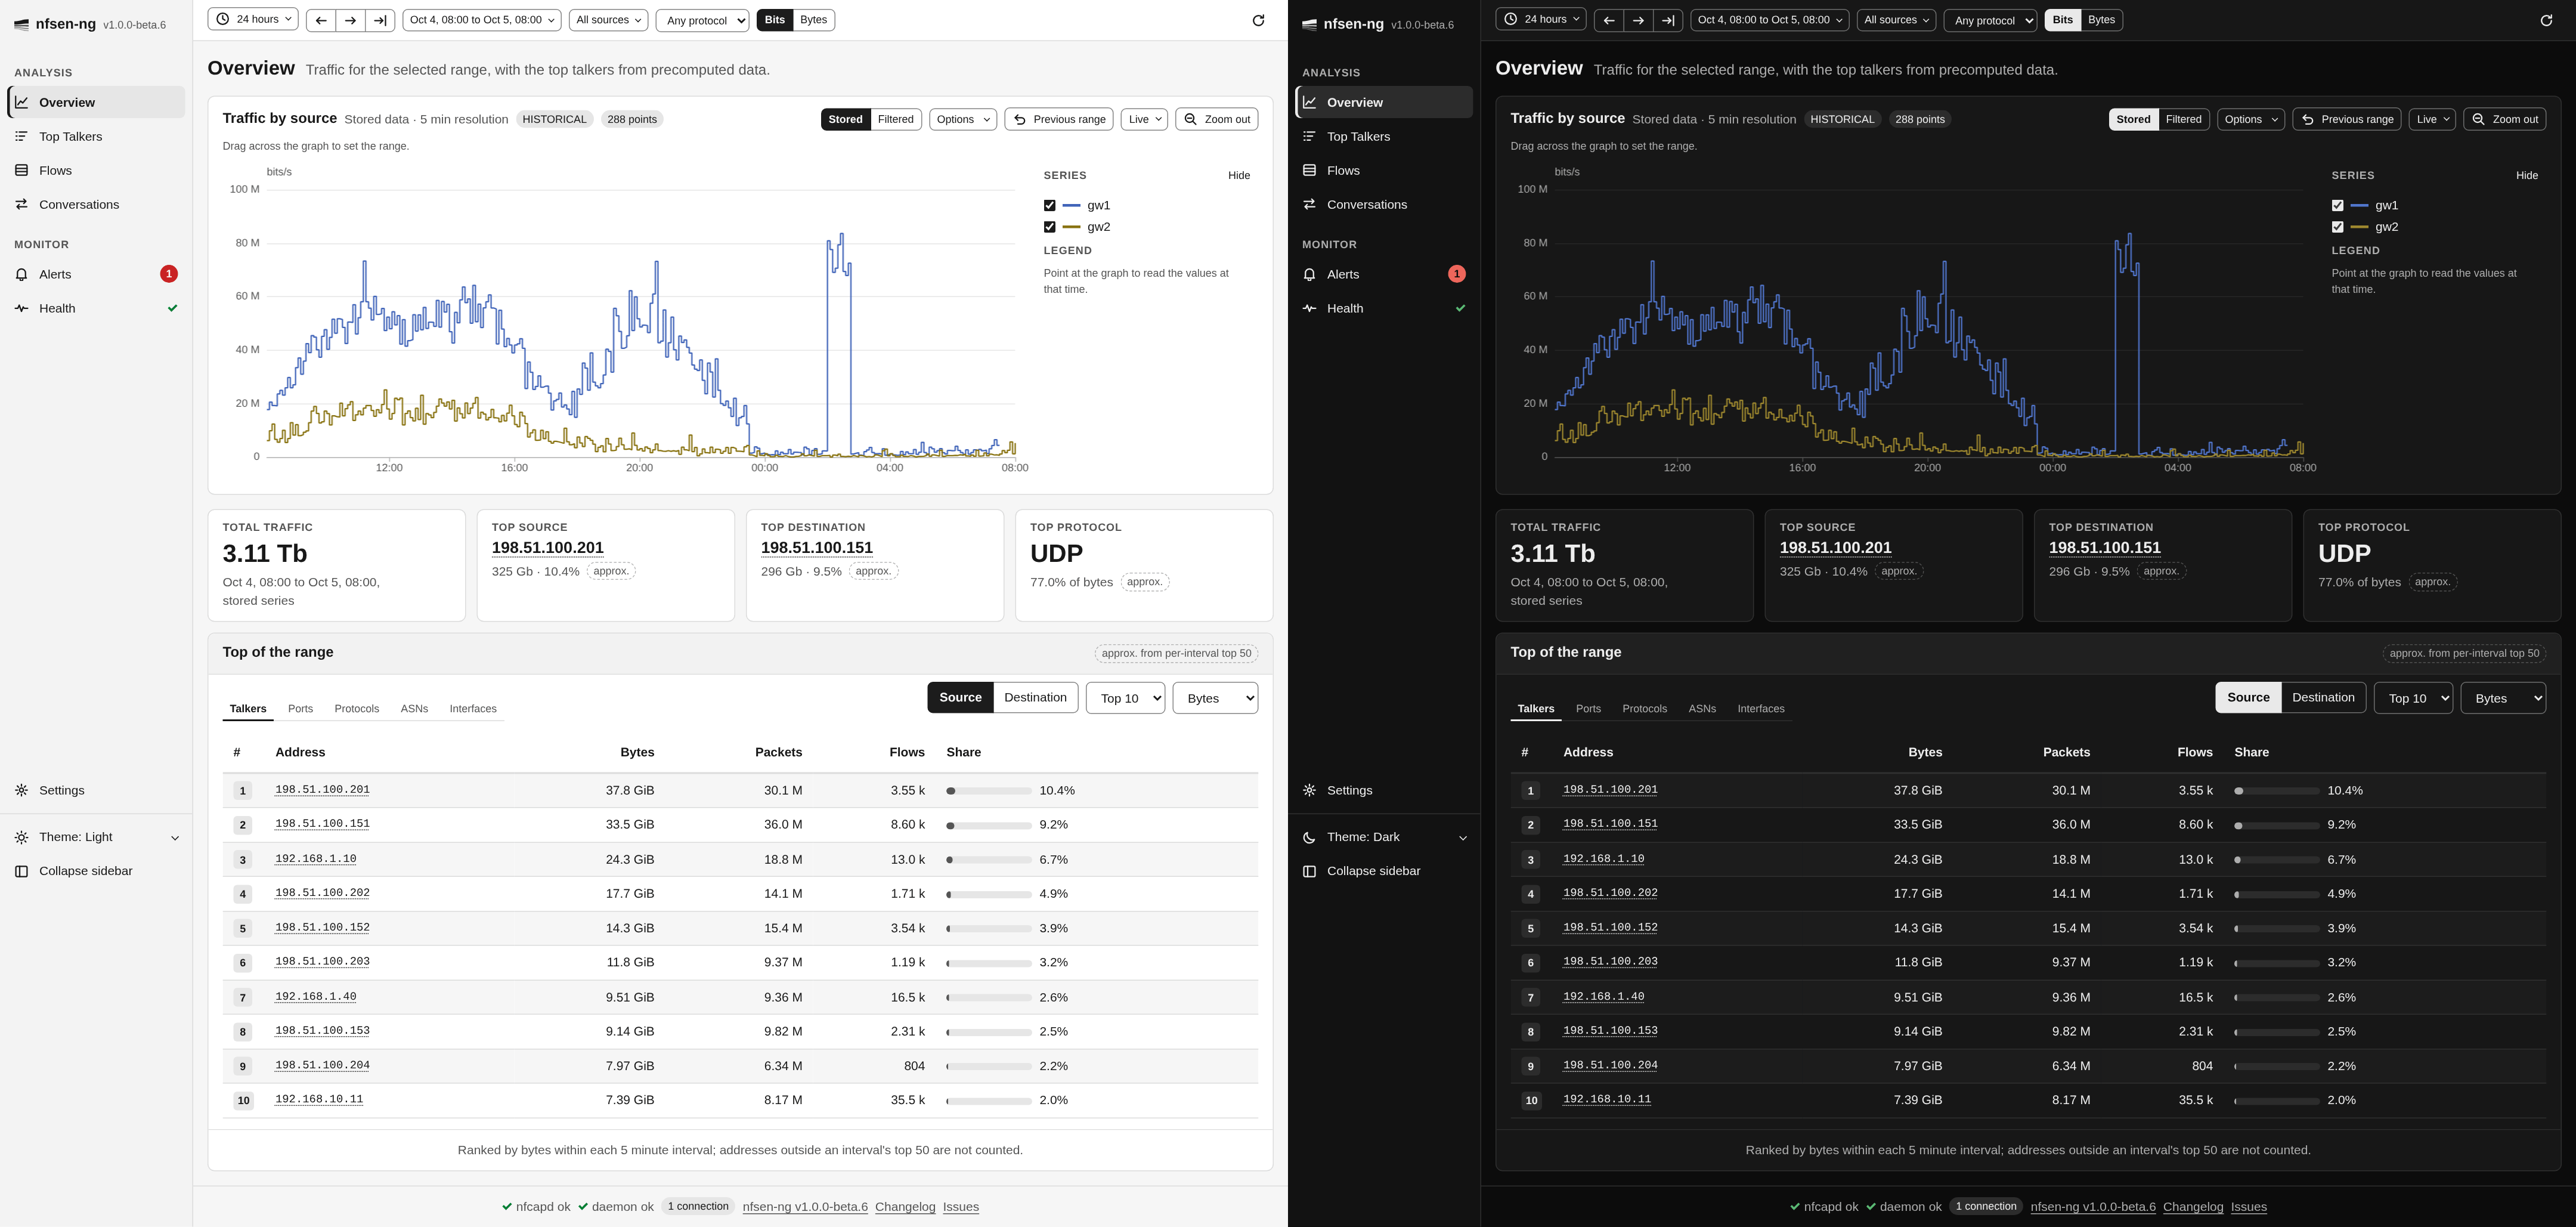
nfsen-ng opens on Overview: the traffic graph for the last 24 hours, four key figures, and the busiest addresses, ports and protocols of that range. An administrator can pick a different start page and range under Settings.
The sidebar
The sidebar on the left lists the pages in two groups. Analysis holds Overview, Top Talkers, Flows and Conversations, the four pages that read traffic; Monitor holds Alerts and Health. Settings sits at the bottom.
A few pages carry a status next to their name. Alerts shows a count while rules are firing, Health shows a dot coloured by the worst check result, and an import icon appears beside Health while an import runs. Each of them also says in words what it shows when you point at it.
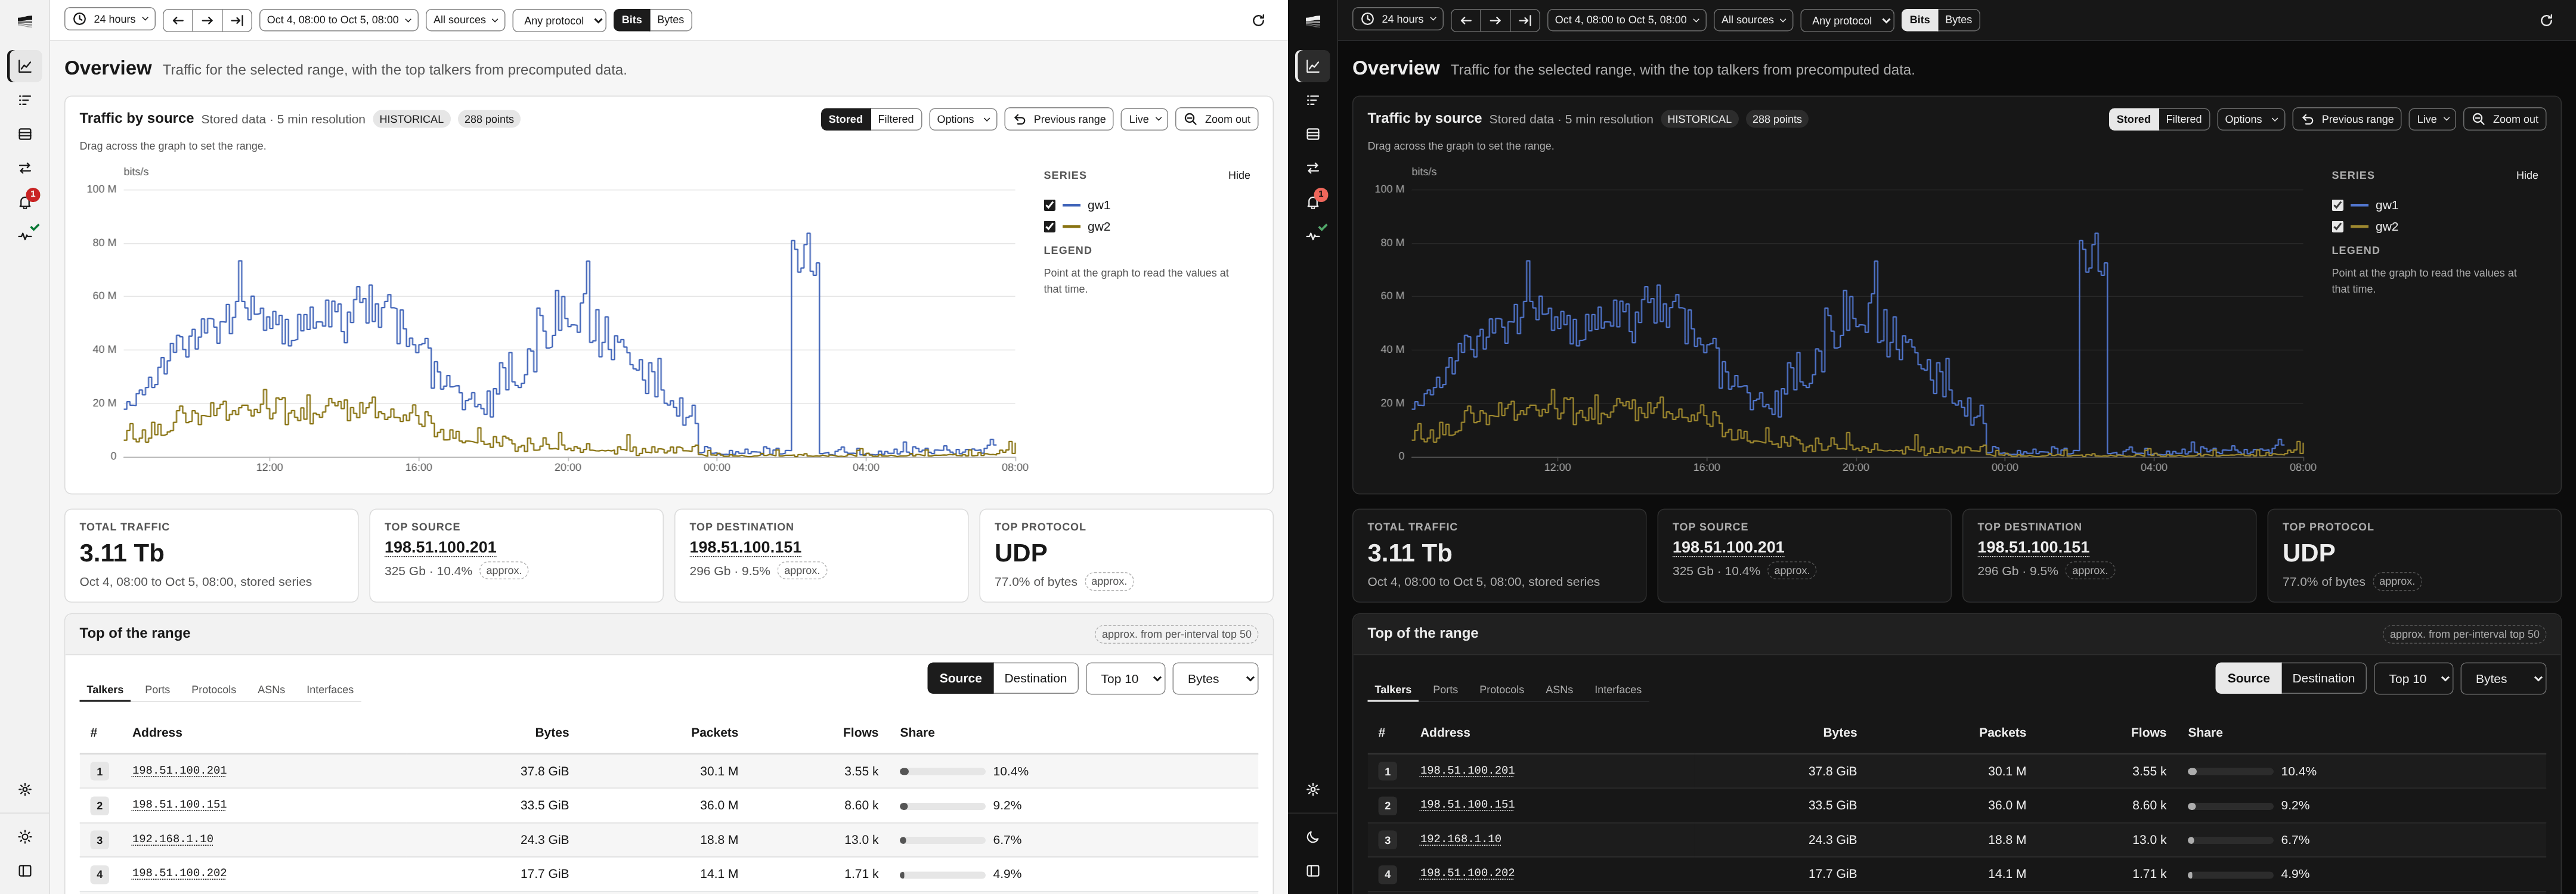
Below the pages are the theme menu (Light, Dark, System, or Use instance default, which follows the choice in Settings) and Collapse sidebar, which shrinks the sidebar to its icons. Both are remembered by this browser only.
Every page has its own address, such as #/flows or #/alerts, so you can
bookmark a page, open it in a new tab with a middle click, and use the browser’s
back button between pages. Switching pages is instant, and what you entered on a
page is still there when you come back to it.
The controls bar
The bar at the top sets the time range and the scope for every page at once:

- Profile, at the start of the bar, appears only when there is more than one nfdump profile (see nfdump Profiles).
- The range menu (clock icon) names the current window. It offers the presets Last 1 hour, Last 24 hours, Last 7 days, Last 30 days and Last year, and a Custom duration: a number of hours, days or weeks, then Apply.
- Previous period and Next period step the window back or forward by its own width; Jump to now moves it to end now. Previous period is disabled at the start of the stored data.
- The start and end of the window are shown next to the step buttons, in the timezone Settings asks for. Click them to type an exact From and To.
- Sources picks which exporters count, as All sources or 2 of 5 sources. At least one stays checked.
- Protocol narrows everything to TCP, UDP, ICMP or Other, or leaves it at Any protocol.
- Bits or Bytes sets the unit for rates and volumes in the graphs and key figures. Result tables always count bytes.
At the end of the bar, a chip appears while an import runs (Import running with its progress and time left, Import behind when more than a dozen files are waiting, Import failed after a failed pass); it links to the Health page. A spinner appears there when the connection to the server drops (see below), and the last button reloads the page.
Live and historical windows
A preset, a custom duration and Jump to now make the window live: it keeps ending now, and the graph says LIVE with the time of its last update. Stepping back, or choosing a window that ends in the past, pins it, and the graph says HISTORICAL. Next period back up to now makes it live again.
The traffic graph
Overview, Top Talkers, Flows and Conversations show the traffic graph above the page. It reads the stored series, so it costs nothing and updates on its own. While the window is live it refreshes every 15 seconds on Overview and every minute on the other three pages, and every open page redraws it after each import.
What it plots depends on the page. Overview shows its own configuration (by source, protocol or port, see Overview); Top Talkers and Flows show Traffic by protocol; Conversations shows one Total traffic line. The line under the title says which data it is, e.g. Stored data · 5 min resolution.
The graph sets the range. Drag across it to make the dragged span the window of every page. The header has the other range tools:
- Previous range goes back to the window before your last change.
- Zoom out shows twice the time around the current window.
- Ctrl + mouse wheel zooms the graph without changing the range. The header then says Previewing and the zoomed span, with Apply (make it the range) and Reset. A plain mouse wheel scrolls the page.
- Live opens a menu with Follow live data (the same as live above), Follow graph zoom (apply every zoom at once instead of previewing it) and Sync zoom to range now.
- Select range, on a touch screen, arms the graph for one drag, since a swipe there scrolls the page.
Running queries
Everything that reads nfcapd capture files costs real time and disk I/O, so it
never starts on its own. The pages that do it (Top Talkers, Flows, Conversations,
and Overview’s filtered graph and exact run) show an estimate first: how many
capture files the query would read, how large they are, and about how long that
takes. The time comes from a default read rate until this server has recorded a
few runs of the same kind, then from their median. Large query marks a query
over 16 GiB, and last 7 days only means the administrator capped the window
with NFSEN_MAX_STATS_WINDOW.
Press Run (or Apply filter on the graph, Build graph for a Flows timeline) to start. The button shows how far along it is with a progress bar and the time left, and Kill stops it:

A result stays until you run again. When you change the filter, the range or any option afterwards, the result says These results are for an earlier query. Run again to update. When a live window has moved on by more than five minutes, it says which span it covers instead.
Filters
Every nfdump filter field checks what you type against nfdump itself, a moment after you stop typing, and says Valid filter or shows nfdump’s error. Its Builder and Saved buttons open the filter builder, with a field reference, examples and your saved filters.
The footer
The footer shows whether nfcapd is delivering (nfcapd ok, stale or no data), the state of the import daemon (ok, starting or disabled), how many browser connections the server has, the version, and links to the changelog and the issue tracker.
If you see a reconnecting spinner
nfsen-ng pushes live updates to your browser over a persistent connection (Server-Sent Events). If that connection drops (your laptop slept, a proxy timed out, the server restarted), a spinner appears at the end of the controls bar, next to the reload button. It reconnects automatically; you don’t need to reload, though the reload button never hurts if it seems stuck.
On a phone
Below 768 pixels wide, the sidebar becomes a tab bar at the bottom with Overview, Flows, Conversations, Alerts and More. More holds Top Talkers, Health, Settings and the theme choice, and is marked while one of its pages is open. The graph comes first, the page follows in one column, the controls bar keeps the range menu and folds the rest behind More controls, and each query form folds behind Show filters.
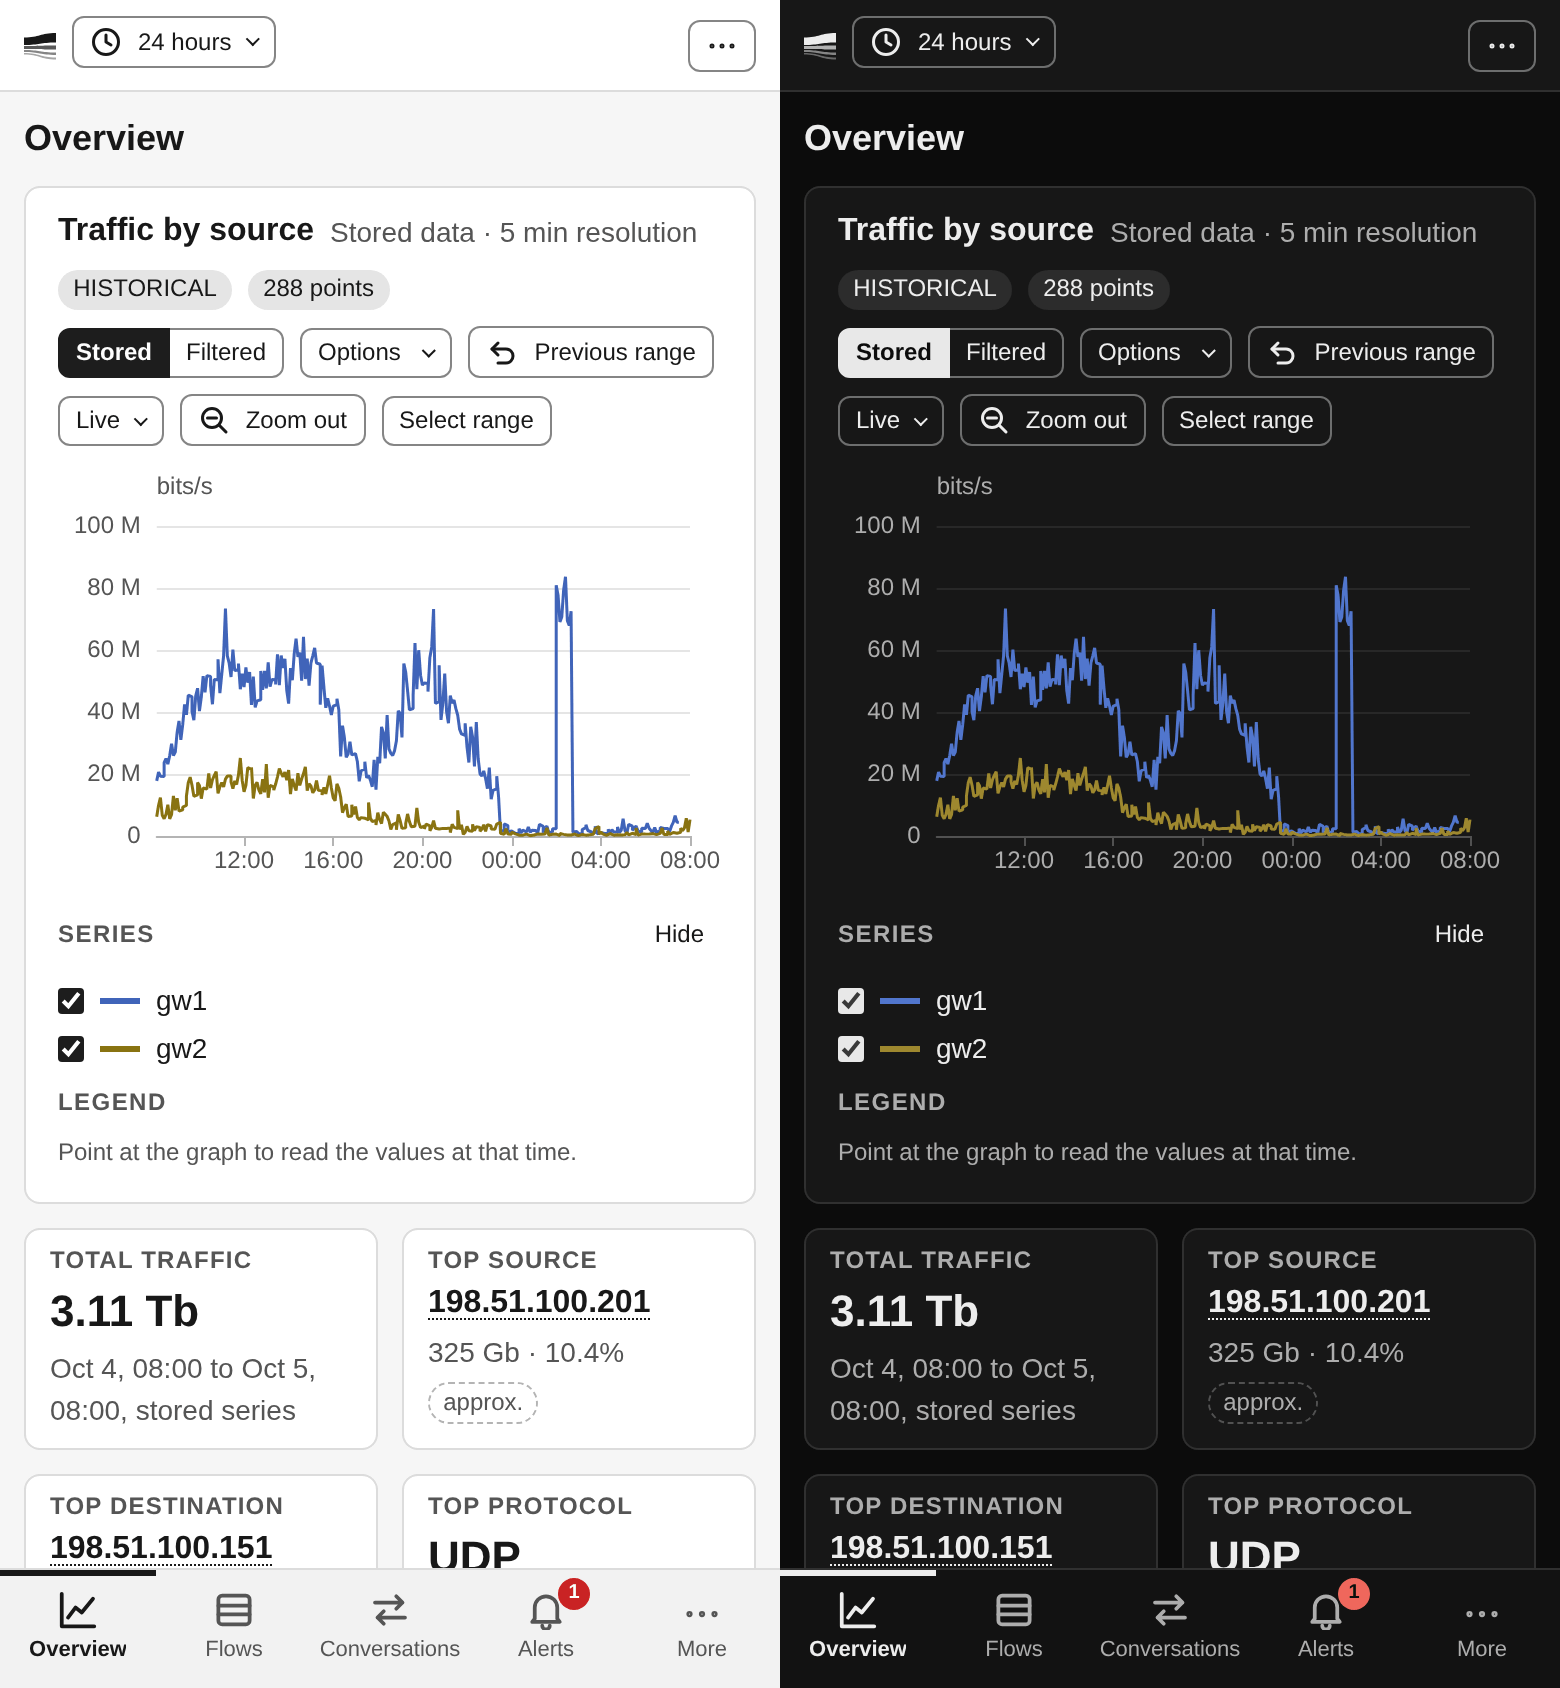
Where to go next
- Overview: reading the traffic graph and the top lists, and graphing only what a filter matches
- Flows: searching individual flow records
- Setting Up Alerts: get notified when traffic crosses a threshold
Overview
Overview answers “what did the traffic look like, and who made most of it?” for the range in the controls bar. It is the only page that shows something as soon as it opens: the graph reads the stored series and the top lists come from data the import already collected, so nothing waits for a query.
Reading the graph
The title says what is plotted (Traffic by source, Packets by protocol, …), and the line next to it which data: Stored data · 5 min resolution for the series the import writes, Filtered data for a graph built through a filter (see below). A LIVE badge with the time of the last update means the window follows the newest data; HISTORICAL means it stays where it is. The last badge counts the data points.
The panel beside the graph has two lists. Series has a checkbox with the line’s colour for every series, to hide the ones in the way. Legend shows the values at the time you point at, largest first. Hide folds the panel away. Pointing at a line lifts it and fades the rest.
The graph also sets the time range for every page: drag across it. The Quick Tour describes the zoom, preview and Live controls in its header.
Choosing what to plot
Options in the graph header opens the settings of this graph:

| Control | What it does |
|---|---|
| Display by | Sources (one line per exporter), Protocols (TCP, UDP, ICMP, Other) or Ports (one line per tracked port you pick) |
| Data type | Traffic, Packets or Flows |
| Resolution | How many points to draw, from 50 to 2000 |
| Scale | Linear or Log |
| Style | Stacked areas or single Lines |
| Line | Step or Curve |
The sources, the protocol and the unit (bits or bytes) come from the controls bar and apply here too. The protocol there narrows the Sources and Ports displays; the Protocols display always shows all four protocols and says so. Scale, Style and Line only change the drawing and are remembered by this browser.
Graphing what a filter matches
The stored series hold totals per source, protocol and port, so there is nothing in them to narrow down by address after the fact. Switch the Stored and Filtered toggle in the graph header to Filtered to plot any nfdump filter instead: nfsen-ng then re-reads the capture files, one nfdump run per point, several at a time.
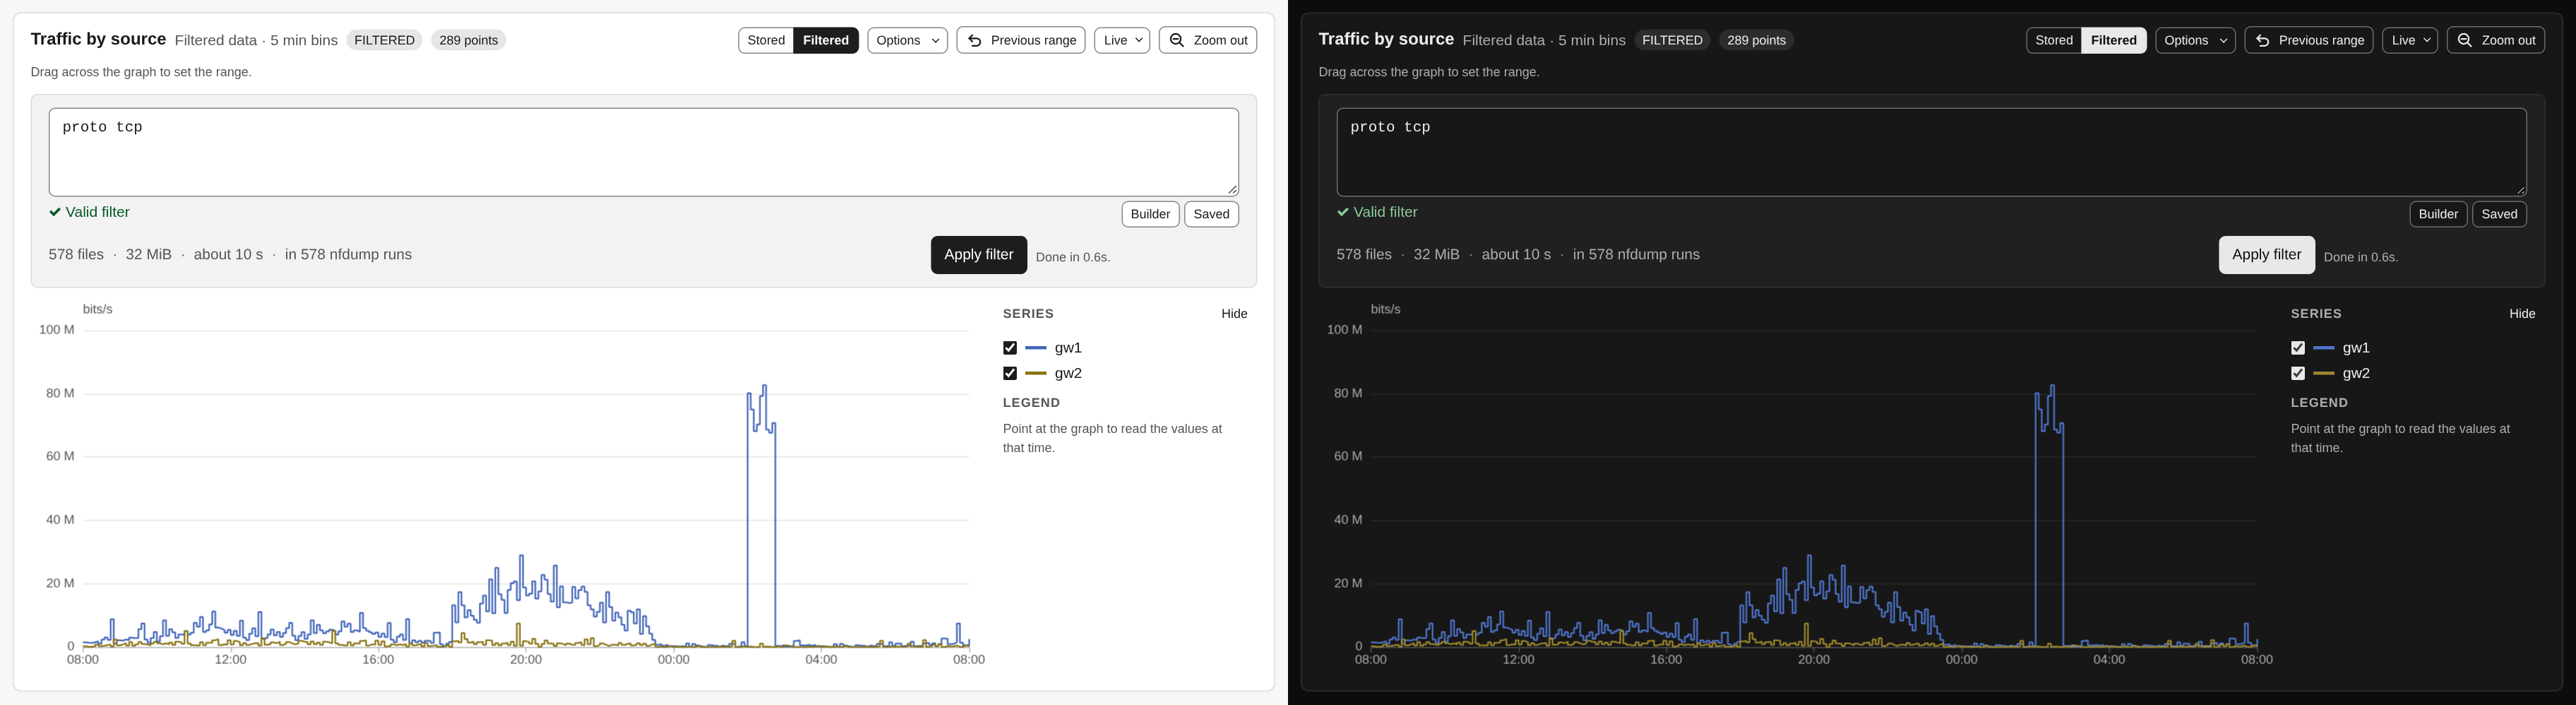
That reads capture files, so it never runs on its own. Type the filter (the field says whether nfdump accepts it), check the estimate next to it, and press Apply filter. An empty filter graphs all traffic. The button shows progress and the time left, and Kill stops the build at once, keeping the points it has. The graph then says FILTERED and does not refresh itself. The Ports display is not available in this mode, because the filter already is the port selection. Narrow the range first; the window width, not the number of points, decides how long a build takes.
To see a filter as a timeline and as individual records, filter on Flows and open Traffic over time there.
Key figures
Four cards sit under the graph:
- Total traffic in the range, from the stored series, in the unit of the controls bar.
- Top source and Top destination, the busiest addresses with their volume and share of bytes. Click an address to look it up.
- Top protocol with its share of bytes.
The three top cards come from the precomputed lists described below and carry an approx. badge. Instead of a figure they can say Computing, Collecting (nothing collected yet), Outside the 31 day window, or Top-N disabled.
Top of the range
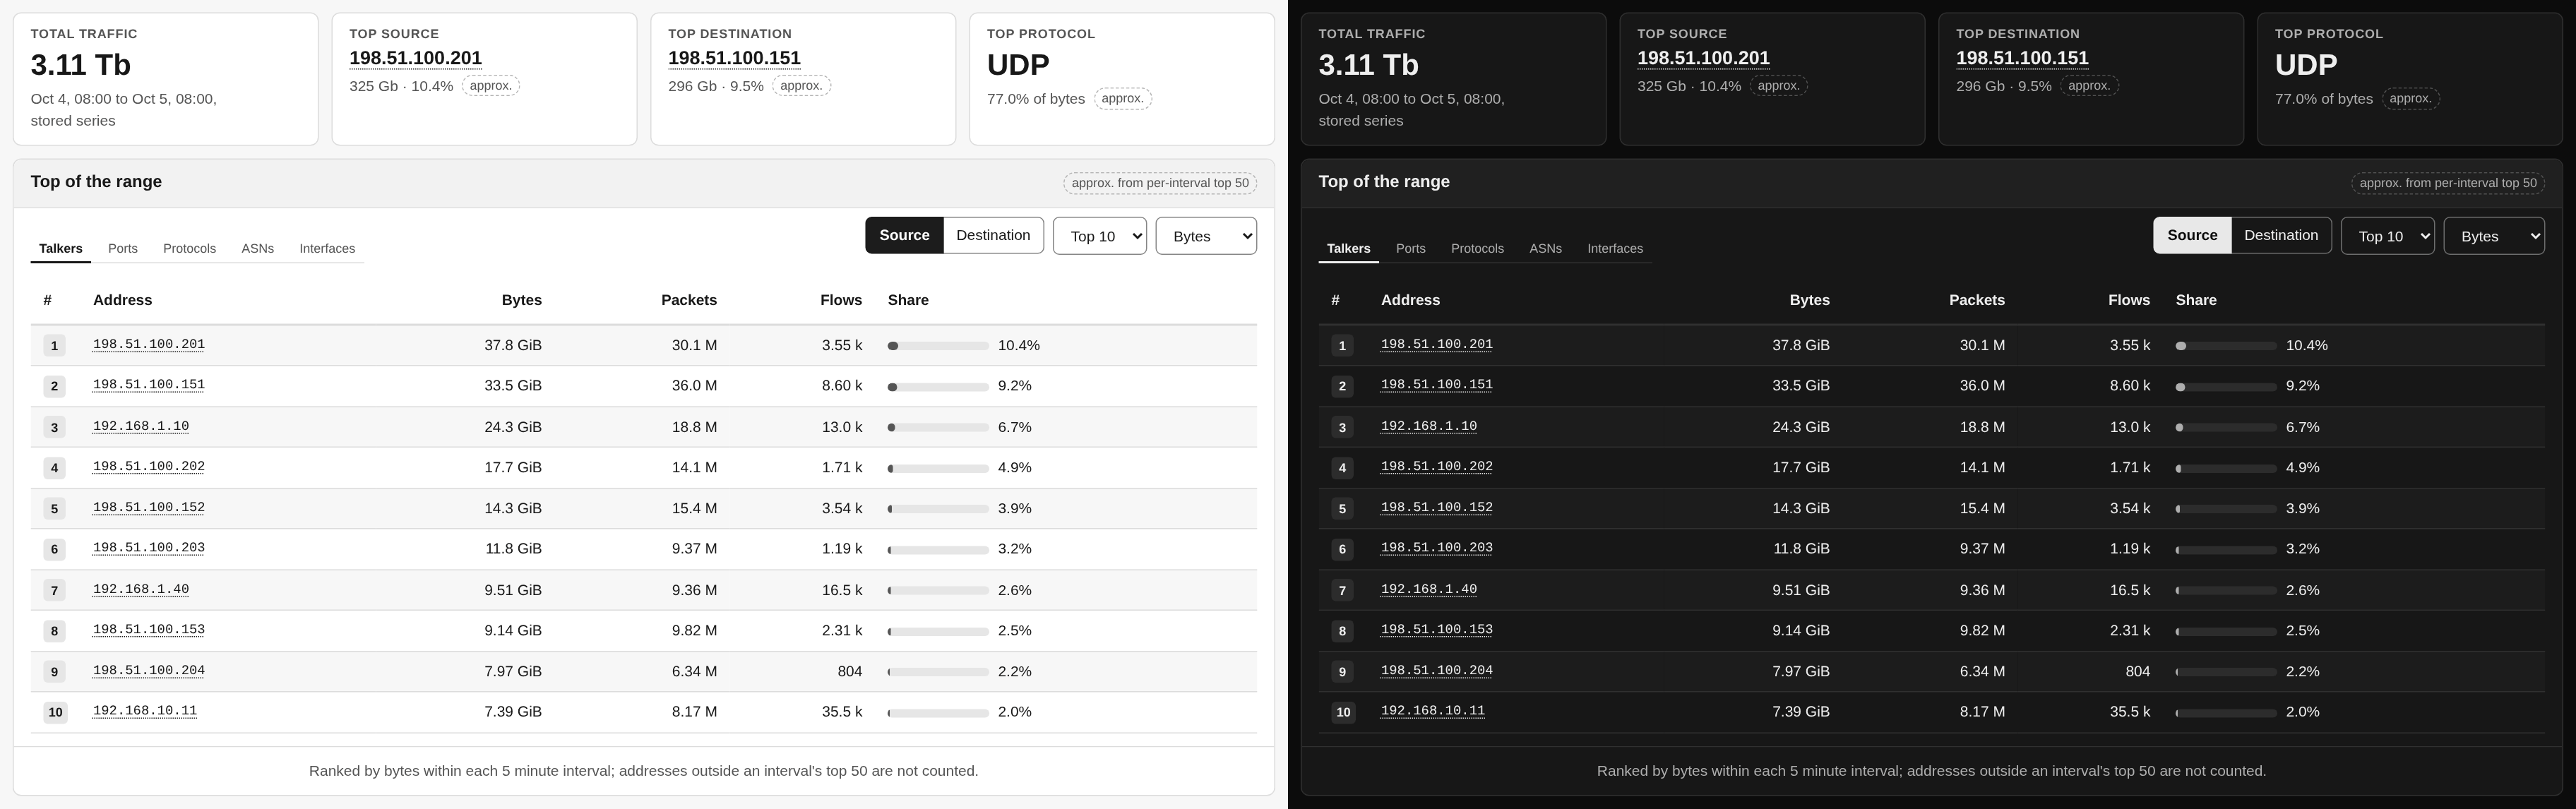
The card under the key figures ranks the busiest keys of the range, one tab each for Talkers (addresses), Ports, Protocols, ASNs and Interfaces. Next to the tabs you choose Source or Destination (In or Out for interfaces; protocols have no direction), Top 10, 20 or 50, and the order: Bytes, Packets or Flows. Each row shows bytes, packets, flows and its share of the range’s bytes. Click an address to look it up.
The lists are approximate, and the card says so. While importing, nfsen-ng stores the top 50 of every statistic for each five-minute capture file, and the card adds these up over the range. A key that never made an interval’s top 50 is not counted, so a host that is always 51st is missing. The footer of the card repeats this rule, says when the stored intervals cover less than 95 % of the range, and, while a protocol is selected in the controls bar, that the protocol does not narrow these lists. The intervals are ranked by bytes, so ordering by packets or flows is labelled ranked by bytes per interval. For ranges up to six hours an In top 50 column says in how many intervals each key made the list.
The rank numbers take a graph colour only when the row is a line in the graph above: protocols while the graph shows the Protocols display, and ports while it shows those ports. Everything else stays neutral.
Ranges outside the stored lists
The lists reach back as far as the administrator configured, 31 days by default
(NFSEN_TOPN_RETENTION_DAYS). For a range that starts earlier, or when
collection is off, the card offers Run exact query instead: the same list
computed by nfdump from the capture files, with the usual estimate before you
press it. The result is labelled Exact (nfdump) with the command it ran, and
its share column is nfdump’s own share of the bytes in the capture files it read.
Those can be fewer than the stored graph covers, because capture files are often
kept for less time than the series.
What’s next
Once you spot something on the graph, drag across it to narrow the range, then open Top Talkers for exact rankings of that window, Flows for the records themselves, or Conversations to see who talked to whom.
Top Talkers
Top Talkers answers “who are the top N?”: the busiest hosts, ports, protocols, autonomous systems or interfaces of the range, ranked and totalled, exactly as nfdump counts them. Overview shows similar lists at no cost, but they are approximate and reach back only a month; this page reads the capture files and is exact for any range they cover.
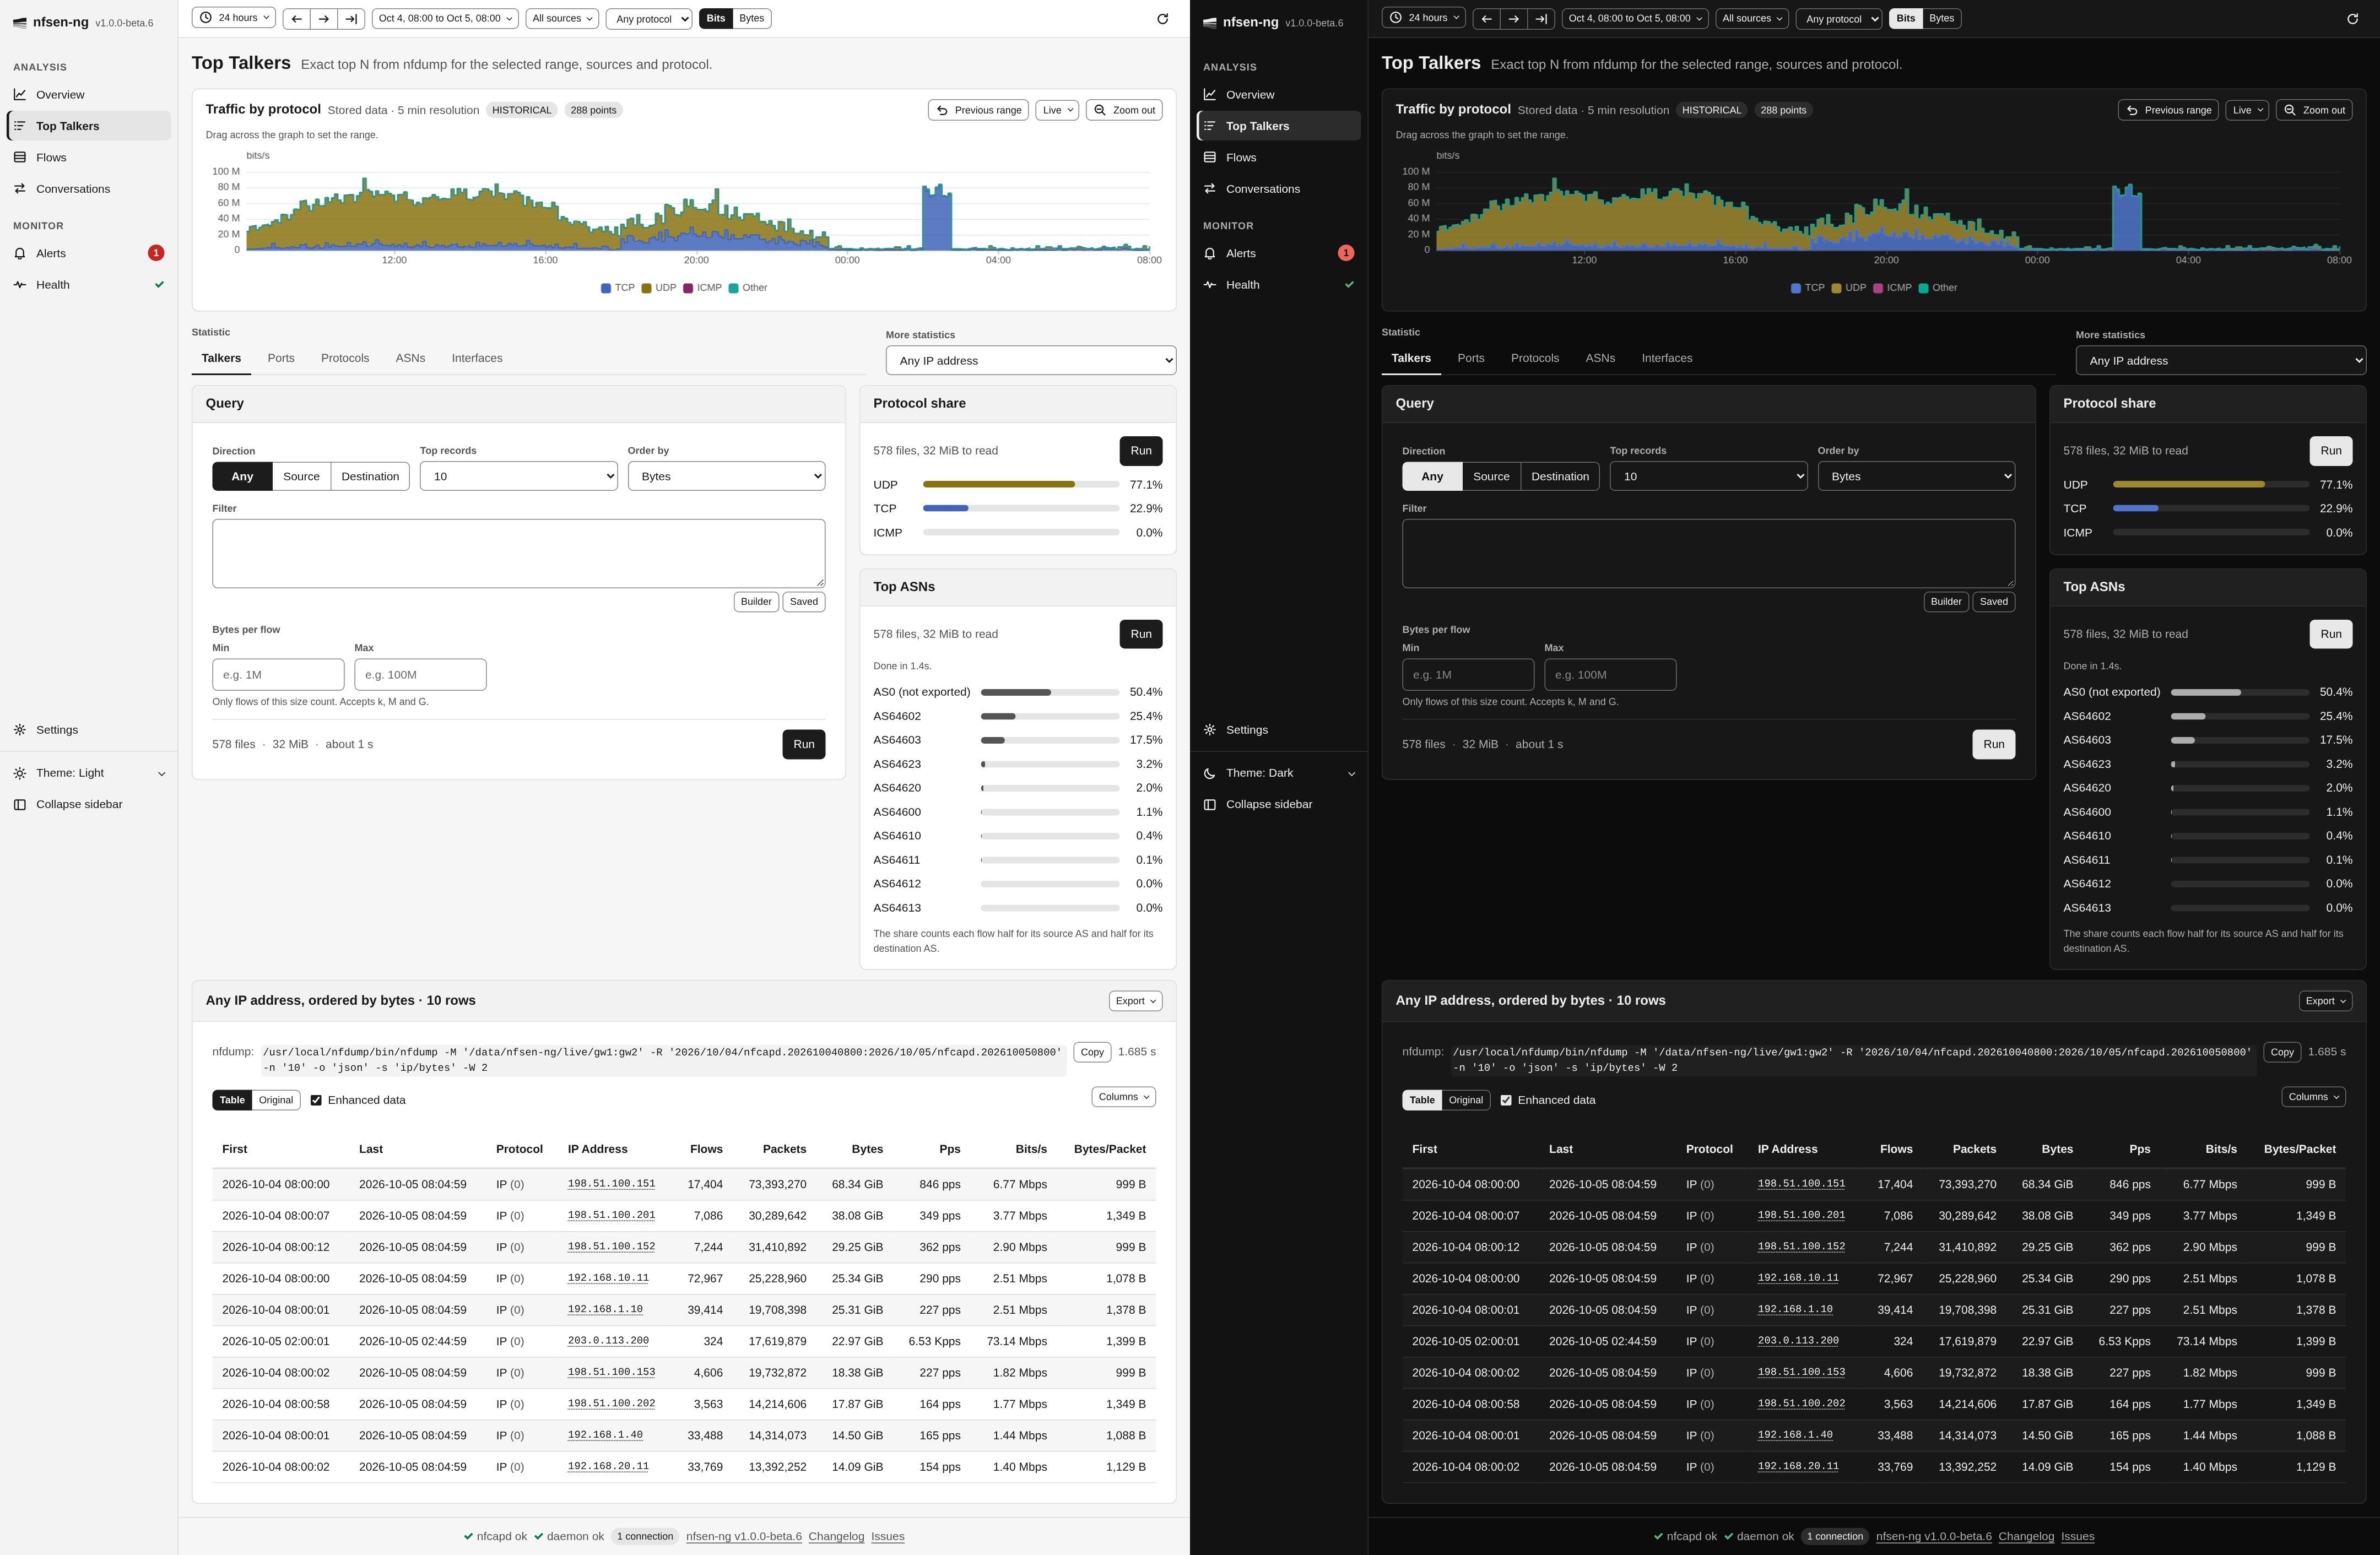
Choosing a statistic
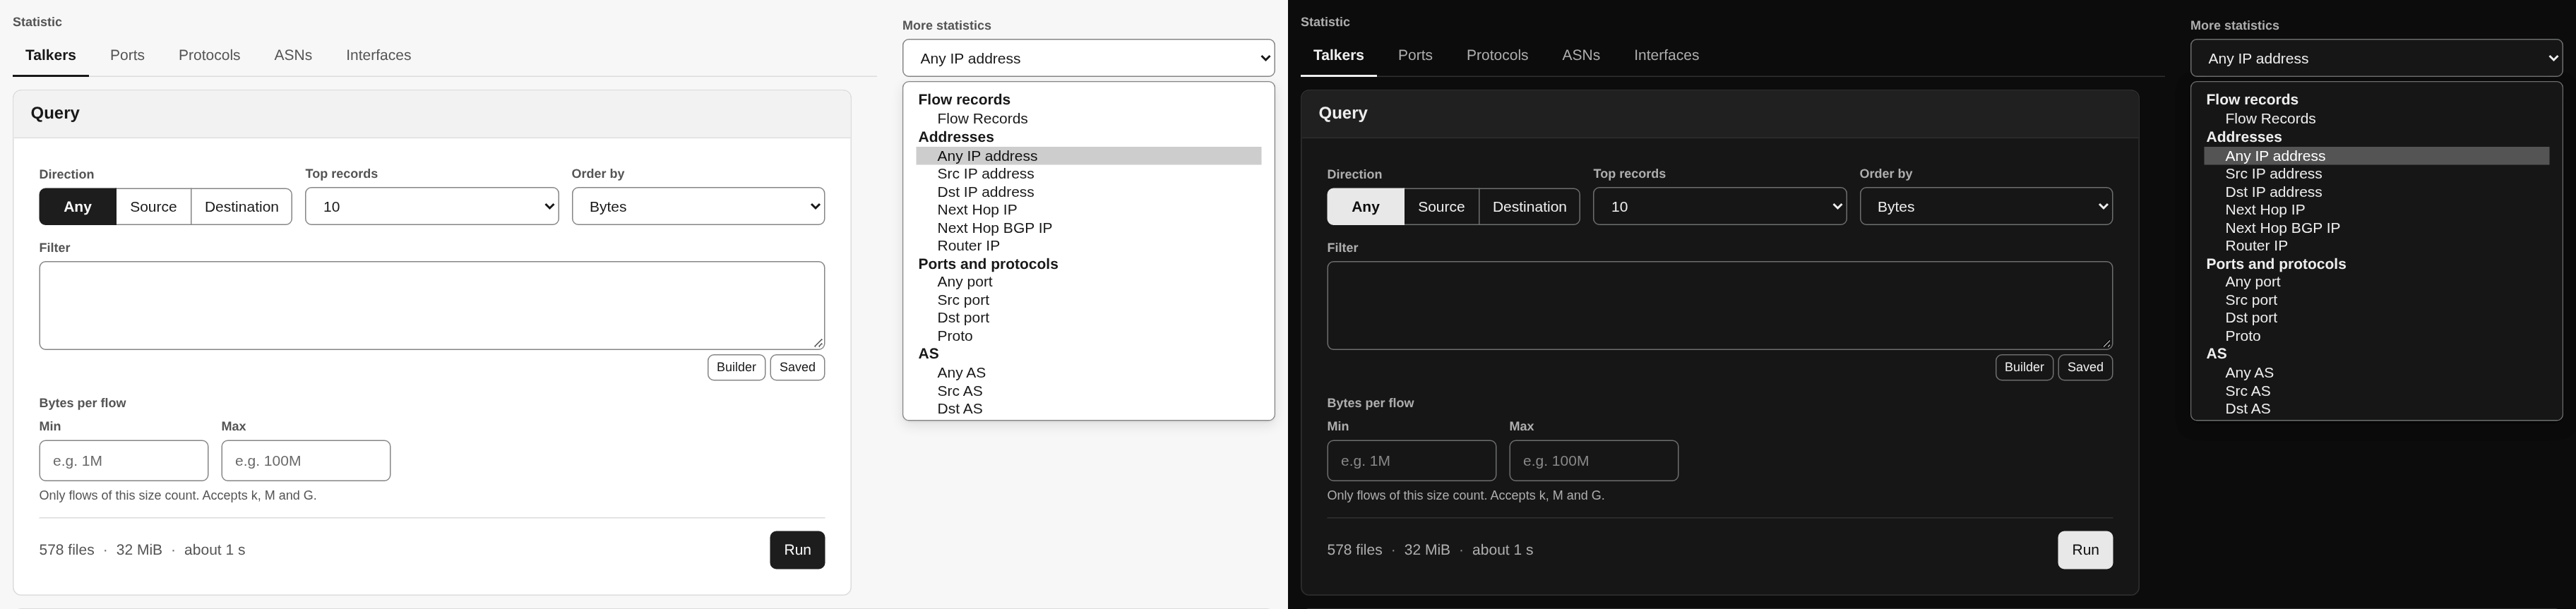
The Statistic row picks the common ones: Talkers (IP addresses),
Ports, Protocols, ASNs and Interfaces. Direction in the query
card decides which side counts: Any, Source or Destination (for
interfaces: in or out; protocols have no direction). Talkers with Destination
is nfdump’s dstip statistic, Ports with Any is port, and so on.
More statistics lists every statistic nfdump offers, 58 in all, in groups: flow records, addresses (including next hop and router), ports and protocols, AS, interfaces, ToS, masks, VLAN, MAC, MPLS, NSEL (Cisco ASA) and NEL (NAT). Statistics that the installed nfdump cannot compute are shown but disabled, marked not supported by this nfdump, with nfdump’s reason in the tooltip. The nfdump 1.7.10 in the Docker image, for example, rejects the five NEL statistics.
Choosing a statistic never runs a query. It shows the estimate for the new statistic, and if you ran that statistic before in this tab, its last result comes back.
Running a query
| Control | What it does |
|---|---|
| Top records | How many rows to return: 10, 20, 50, 100, 200 or 500 |
| Order by | Rank by Flows, Packets, Bytes, Packets per second, Bits per second or Bytes per packet |
| Filter | Any nfdump filter, checked as you type; Builder and Saved open the filter builder |
| Bytes per flow | Only flows between Min and Max bytes count (accepts k, M and G) |
| Aggregation | For Flow Records only, see below |
The range, the sources and the protocol come from the controls bar. Check the estimate, then press Run. The result card is titled with what it ranks (Dst IP address, ordered by bytes) and shows the exact nfdump command it ran, with a Copy button and the time it took.
A large query runs faster on a server with several nfdump processes: nfsen-ng splits a read of more than a second over at least 12 capture files into time slices, runs one nfdump per slice at the same time and merges them into exactly the rows a single run prints. The progress then counts files (Read 120 of 288 files in 4 nfdump processes), and the status says Done in 3.1s with 4 nfdump processes. Rankings by a rate (packets or bits per second, bytes per packet) and Bi-directional always run as one process.
The table sorts by any column, and Columns hides the ones you don’t need (remembered by this browser). Export saves the rows as CSV or JSON or prints them; with Enhanced data on, the export has the formatted values as shown, otherwise the raw numbers. Click an IP address to look it up.
Warnings that belong to a result stay with it: a window shortened by
NFSEN_MAX_STATS_WINDOW, or what nfdump printed on its error output, such as a
truncated capture file. A run you Kill keeps the previous result of that
statistic.
Protocol share and top ASNs
Two cards beside the query answer the questions that usually come next, each with its own Run and the size of what it will read:
- Protocol share splits the bytes of the query into TCP, UDP, ICMP and the rest, as bars in the graph’s protocol colours. With a protocol chosen in the controls bar the answer is trivial, and the card says so.
- Top ASNs lists the busiest autonomous systems. Its share counts each flow half for its source AS and half for its destination AS; point at a bar for nfdump’s byte count of that AS.
Both use the filter, byte limits, range, sources and protocol of the query card. When those change after a run, the card says its result is for an earlier query.
Aggregating flow records
Flow Records ranks whole flows rather than one element of them, so what counts as one flow is a question only you can answer: every distinct 5-tuple, everything to the same port, or everything between two /24s. The Aggregation controls answer it, and they are the same ones the Flows page uses: bidirectional, protocol, source and destination port, and per-direction IP with an optional prefix length.

They appear for Flow Records only, because nfdump applies an aggregation to that statistic alone. The columns change with the aggregation: aggregating by destination port yields a table of ports, because the fields you did not aggregate on no longer identify a row.
Bi-directional merges both directions of a conversation into one row: the
request and its answer become one flow record with In and Out counters
and Flows 2. It is the one query whose output format nfdump chooses for
itself: it prints its merged-flow table as fixed-width text whatever -o it is
given. nfsen-ng reads that table back into columns, so it behaves like any other
result, with nfdump’s text one click away under Original. It needs nfdump
1.7.10: a gcc build of 1.7.8 or 1.7.9 lists the two directions as separate rows
with an empty Out side, and the Health page warns about it.
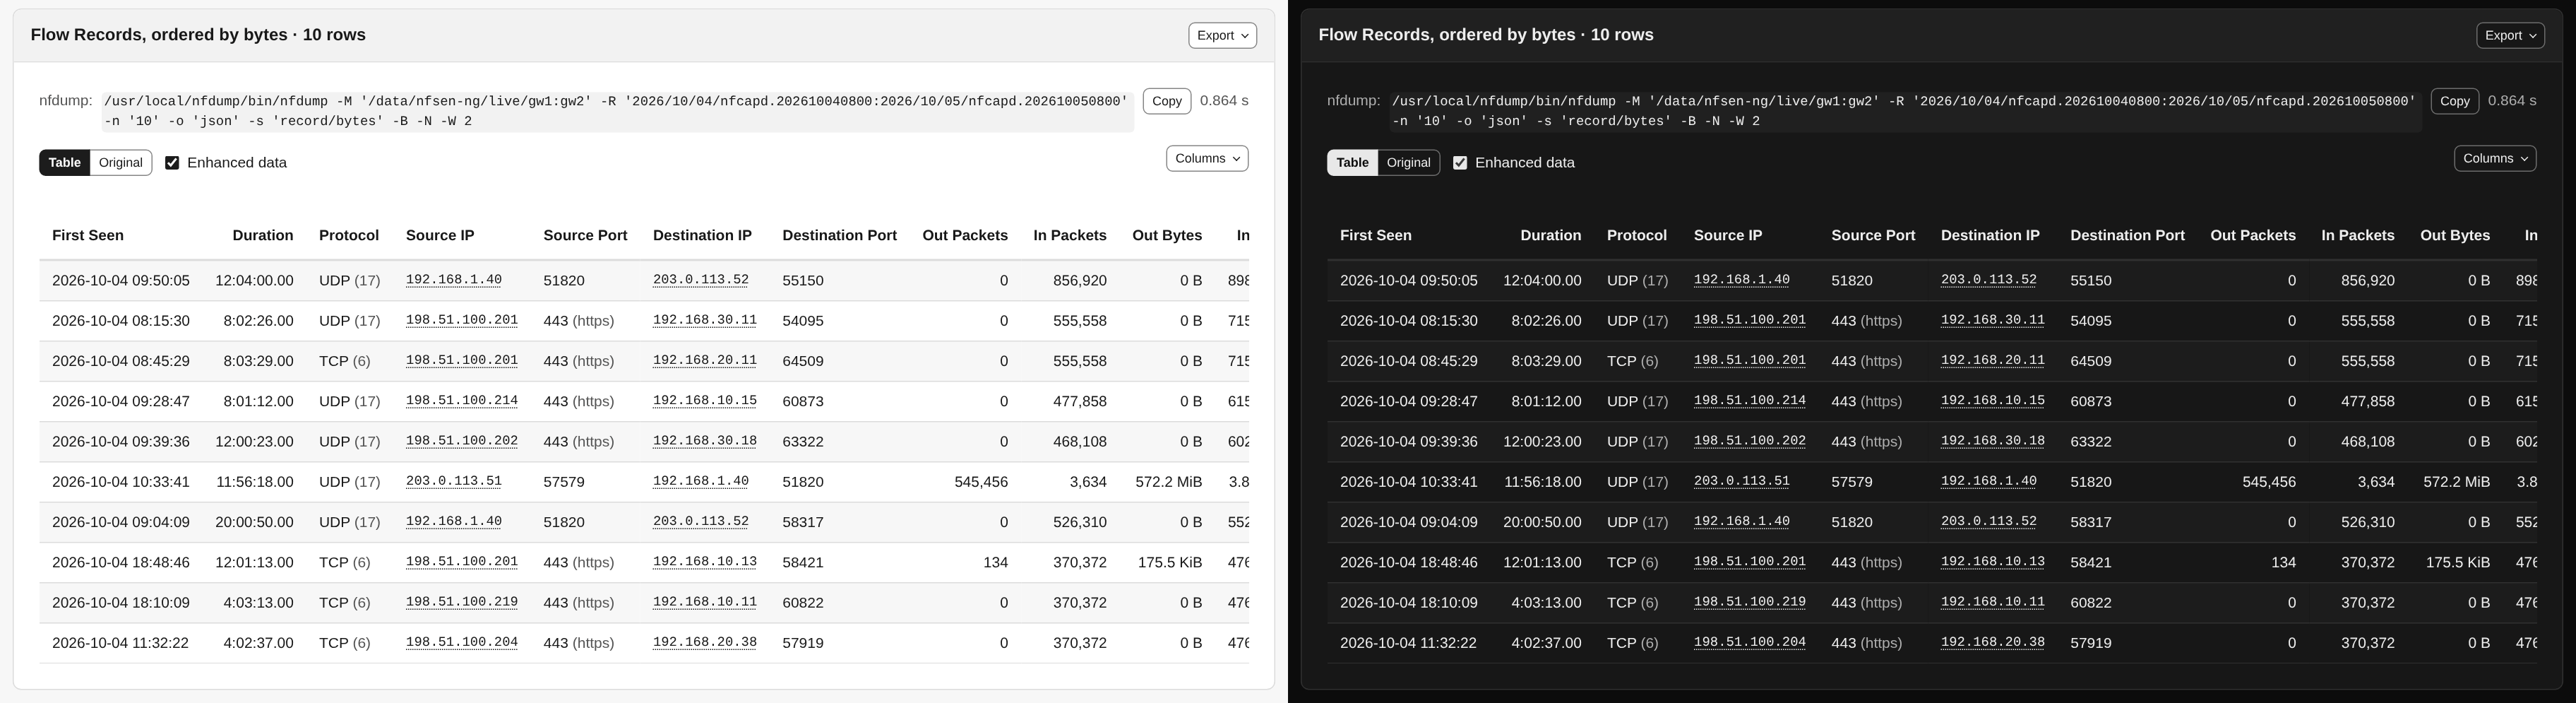
Flows
Flows lists individual flow records for the range: the detail behind the graphs and rankings. Use it when you know roughly when something happened and want to see exactly what.
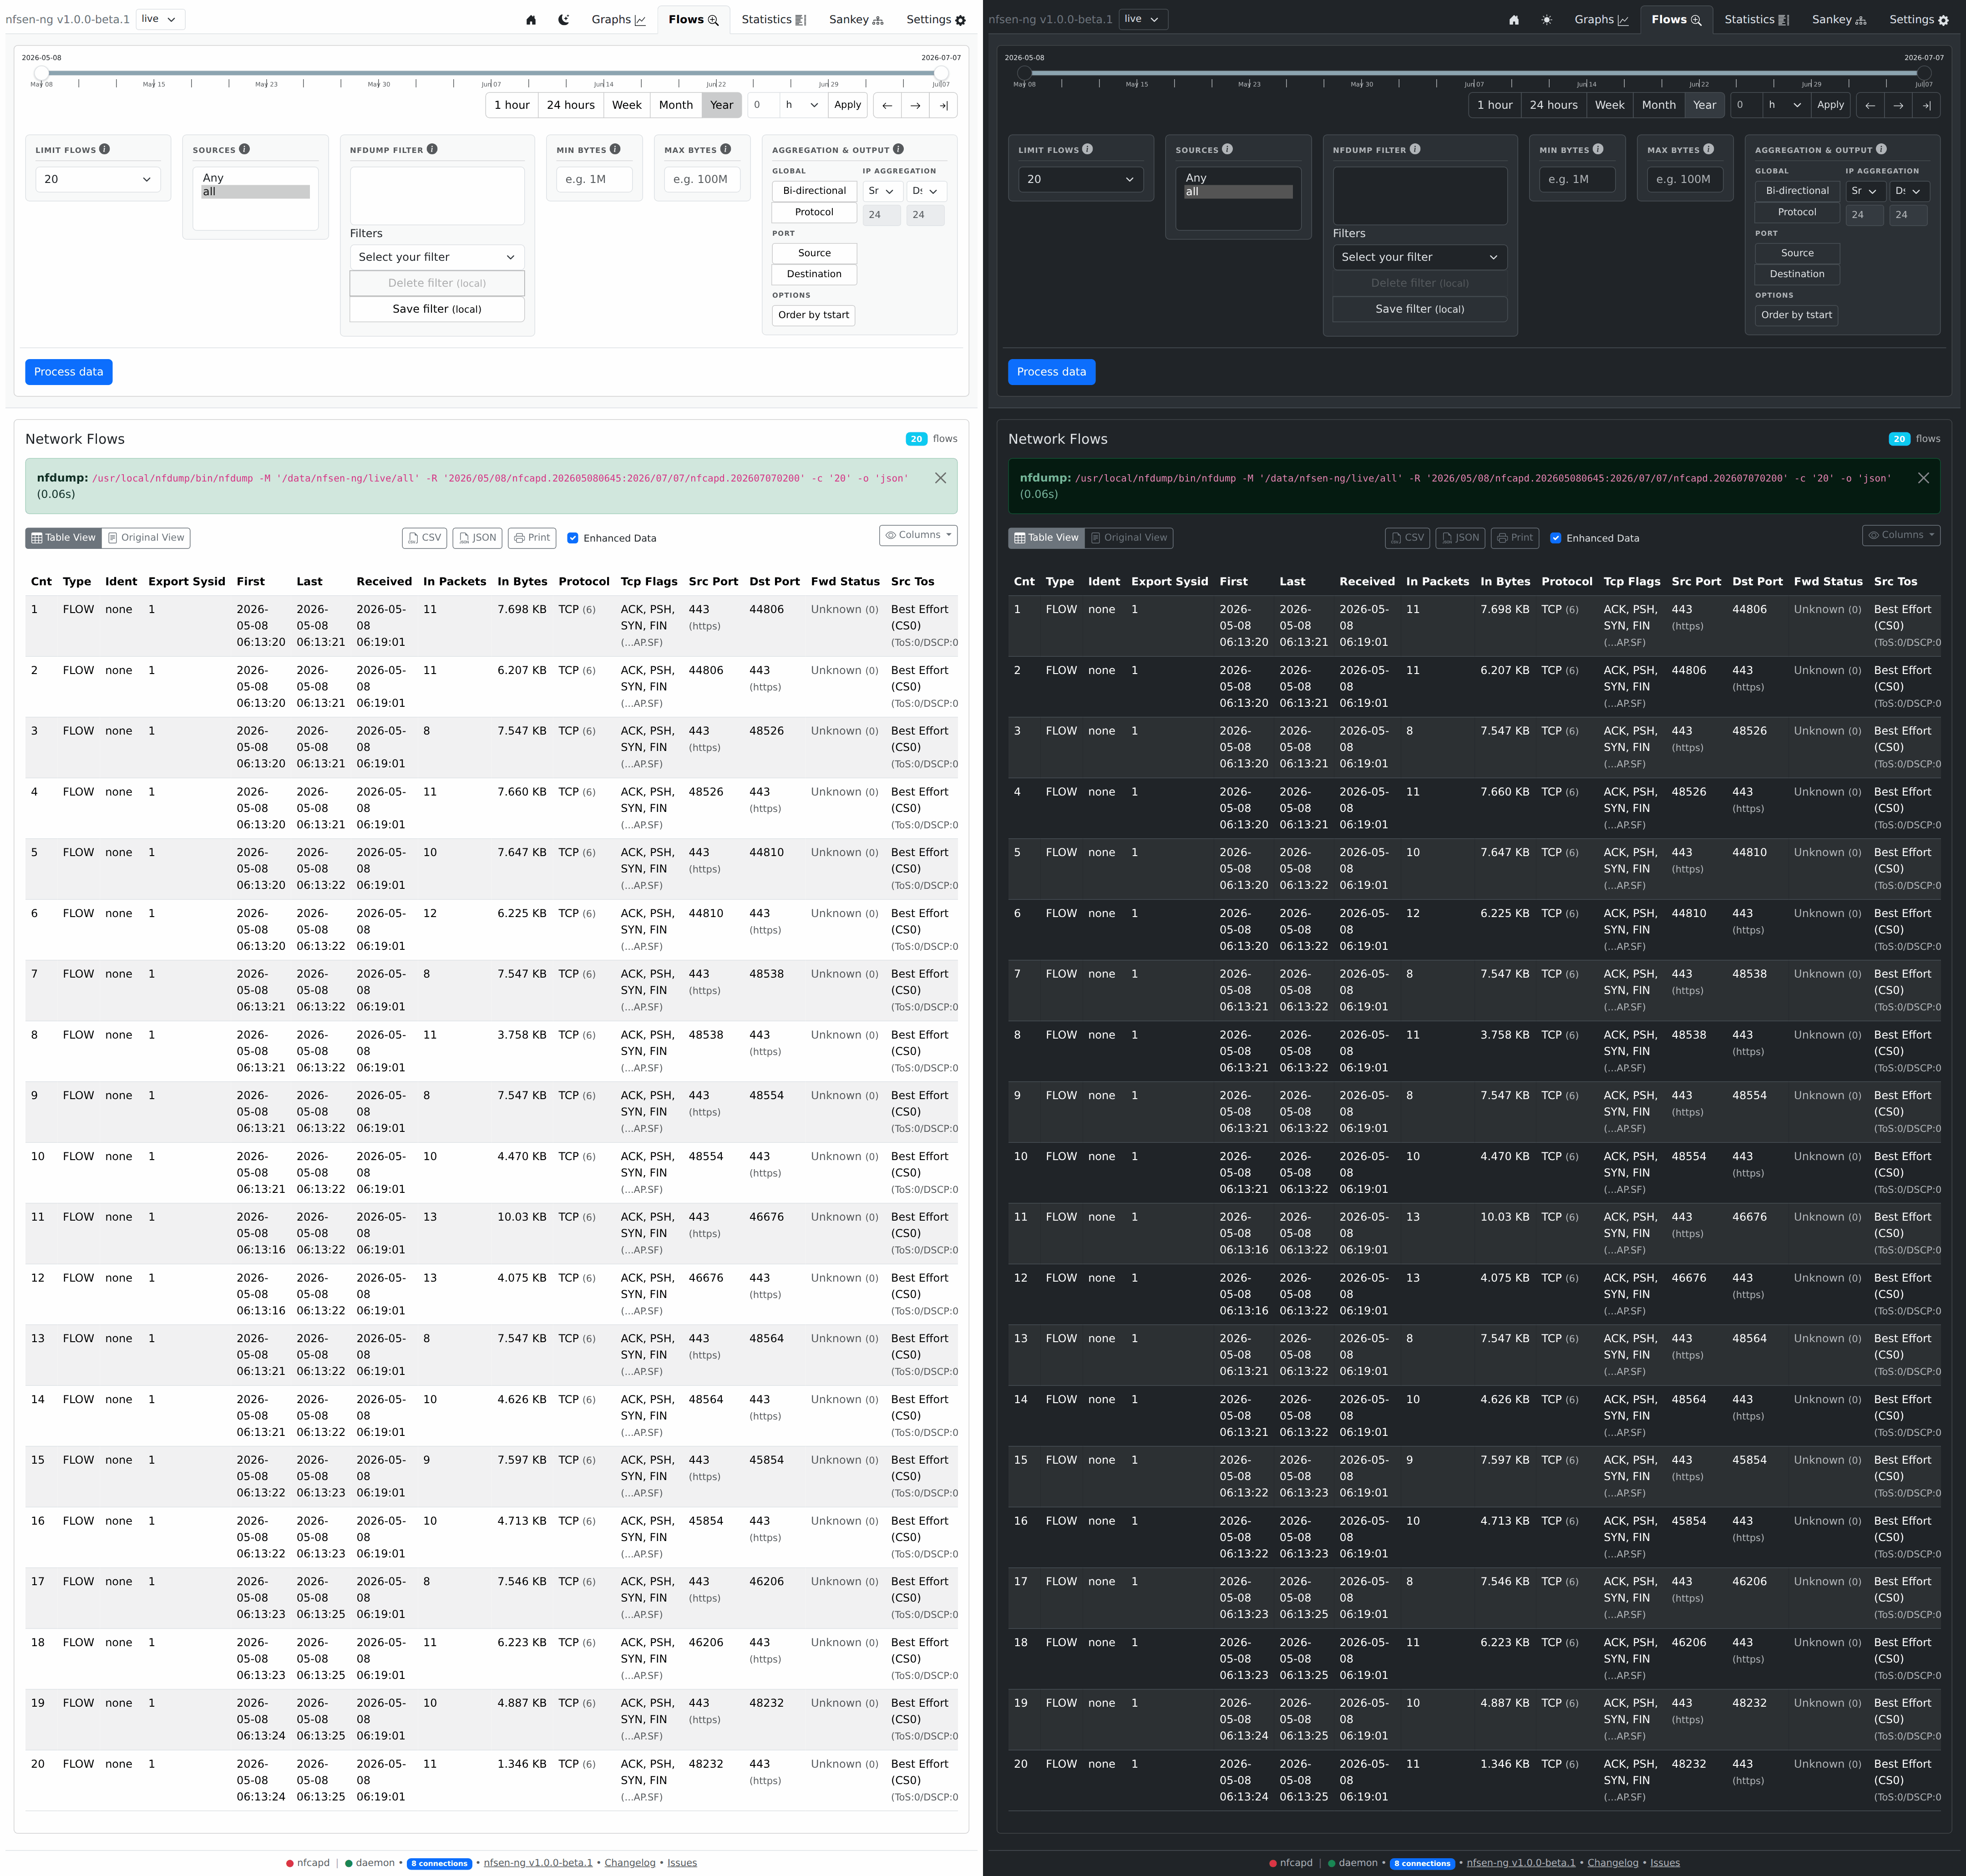
Setting up a query
The Query card holds everything specific to this page; the range, the sources and the protocol come from the controls bar.
| Control | What it does |
|---|---|
| nfdump filter | Free nfdump filter syntax, e.g. proto tcp and dst port 443, checked against nfdump as you type |
| Limit | How many rows nfdump returns (-c): 20, 50, 100, 500, 1,000 or 10,000 |
| Bytes per flow | Min and Max, added to the filter as bytes > min and bytes < max (accepts k, M and G) |
| Aggregation and output | Folded away by default, see below |
If you don’t know nfdump’s filter syntax yet, start simple (proto icmp,
net 192.168.1.0/24, dst port 22) and combine with and and or, or open
Builder next to the field for a reference of every field and a list of
examples. Saved lists the filters you saved; see
Filter builder.
The Estimate card next to the query says what a run would read before you start it: the number of capture files, their size, and how long that takes at most. A Flows query stops as soon as nfdump has the rows the limit asks for, so the time is an upper bound and says stops early once the limit is reached.

Press Run to start. The button shows how far nfdump has read and the time left, and Kill stops the run.
Aggregation and output
To summarise rather than list every flow, open Aggregation and output:
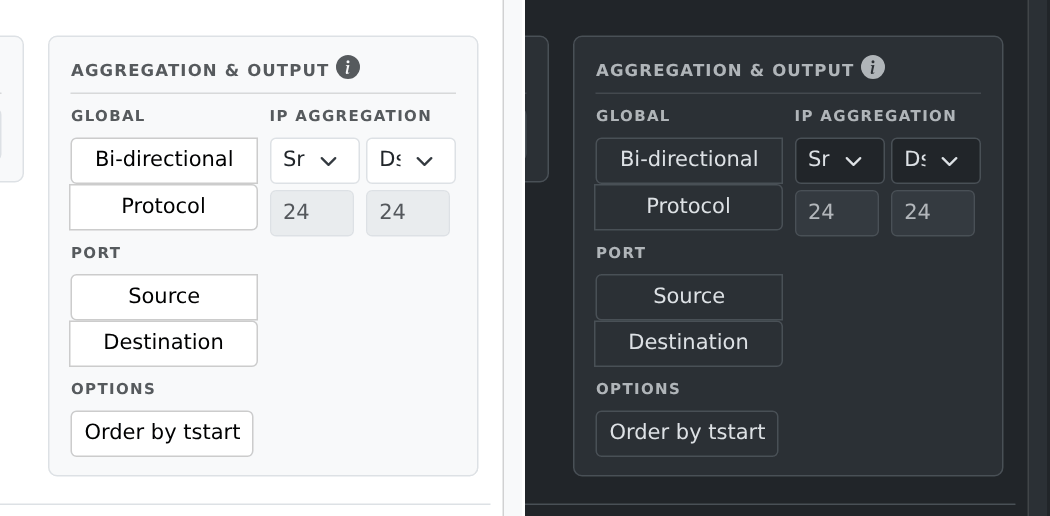
- Global: Bi-directional combines both directions of a conversation into one row, and Protocol collapses by protocol.
- Port: Source and Destination collapse by port.
- IP Aggregation: per direction, collapse addresses to the exact IP or to an IPv4 or IPv6 prefix such as a /24, instead of listing every host.
- Order by start time sorts the returned rows. nfdump still stops after the limit in file order, so it sorts what came back, not the whole range.
These map onto nfdump’s own aggregation (-a, -A and -B): the panel is a
form over nfdump’s options, not a reimplementation of them.
Reading the result
The result has three tabs, and the line next to them says how many rows came back and whether the limit was reached (or, for an aggregated query, how many flows were aggregated).
Flows is one list of every row that came back: scroll it, or walk it with Tab, and the server sends the rows as they come into view. nfdump cannot skip rows, so when the limit is reached the line next to the tabs says so: raise the limit to see more. Click a column header to sort (again for the other direction), use Columns to hide columns, and Export to save every row as CSV or JSON or print them; the next Run keeps the sort and the hidden columns. With Enhanced data on, the export has the values as shown; off, it has the raw numbers. Click an IP address to look it up.
Raw output is what nfdump printed, untouched: the command it ran (with Copy, handy for running the same query in a terminal), the lines nfdump printed beside the data, and its output with Copy and Download. The page keeps the first 5 MiB of a very large output and says so. A Copy button waits for output still on its way, works on an instance served over plain HTTP too, and answers Copied, Nothing to copy or Copy failed; a screen reader hears the same.
Summary puts the rows into context, in three blocks:
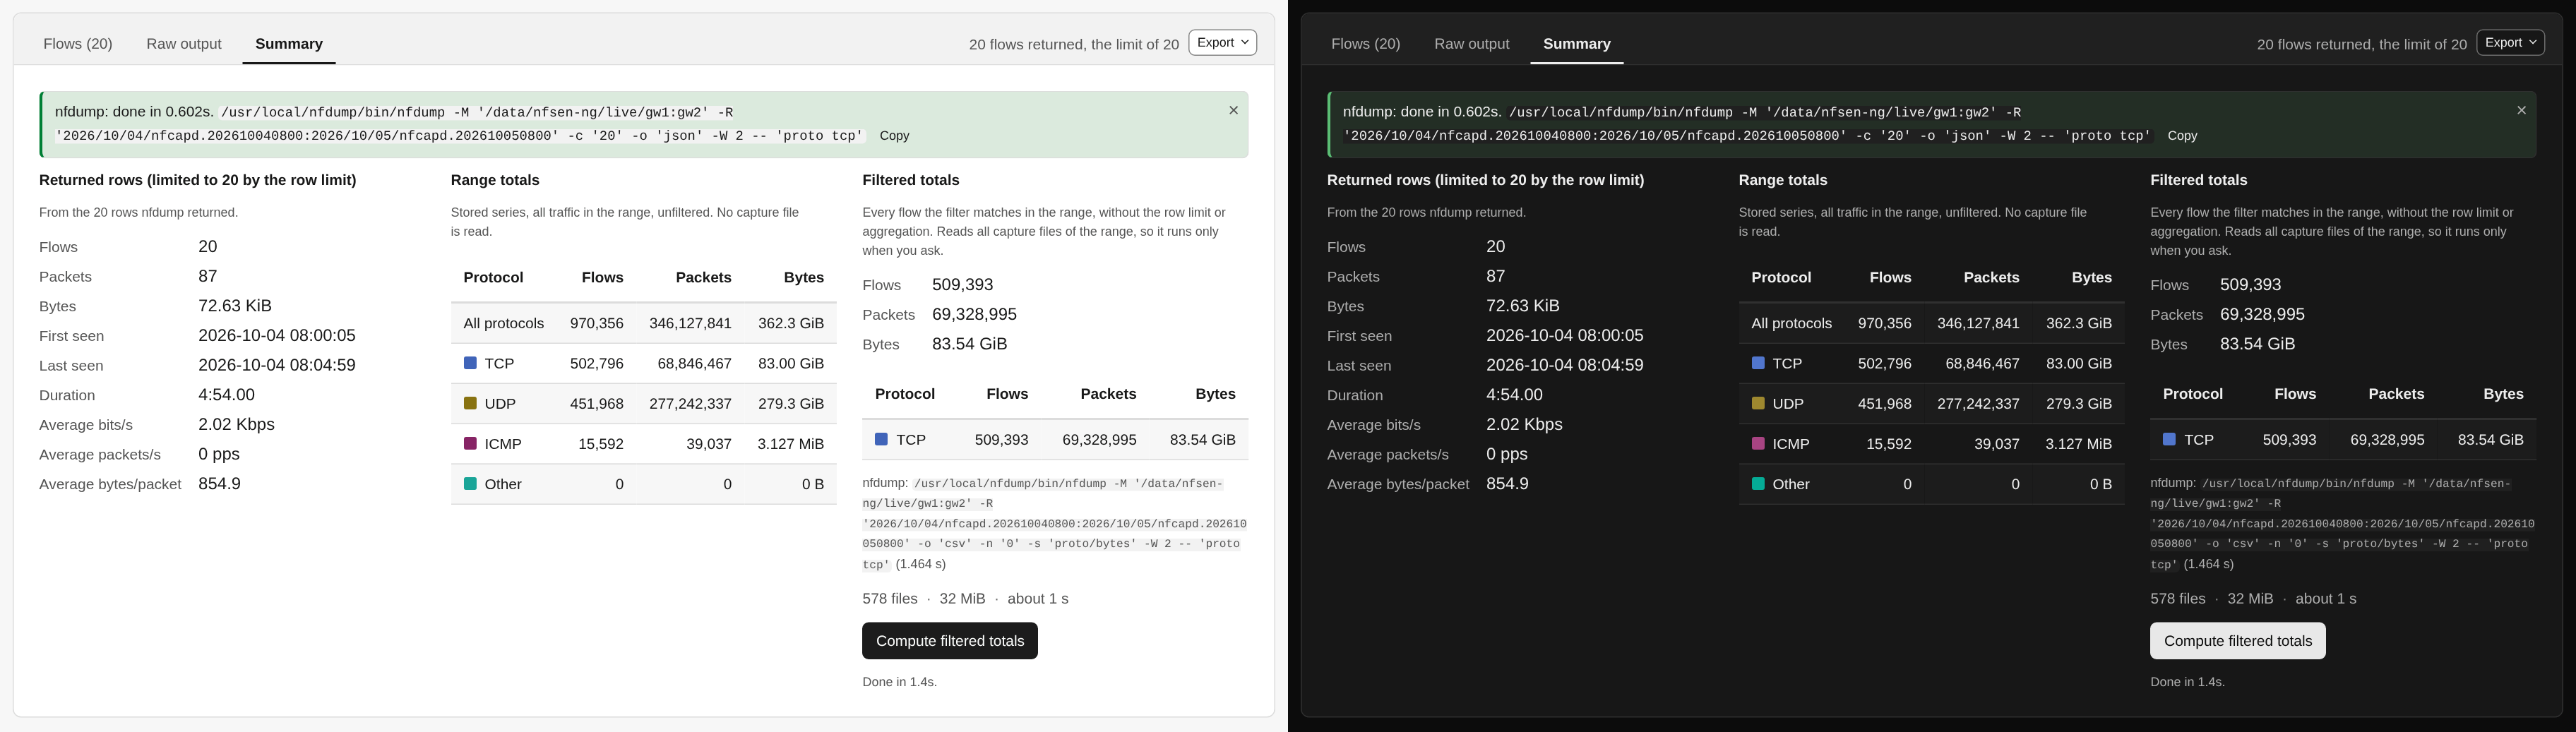
- Returned rows: flows, packets, bytes, first and last seen, duration and averages of the rows nfdump returned, which the row limit may have cut short.
- Range totals: all traffic of the range from the stored series, unfiltered, split by protocol. No capture file is read, so it is there right away.
- Filtered totals: every flow the filter matches in the range, without the row limit or aggregation. That reads every capture file of the range, so it has its own estimate and runs only when you press Compute filtered totals.
Seeing when your flows happened
Traffic over time, the folded section between the query and the result, plots the current filter over the range:
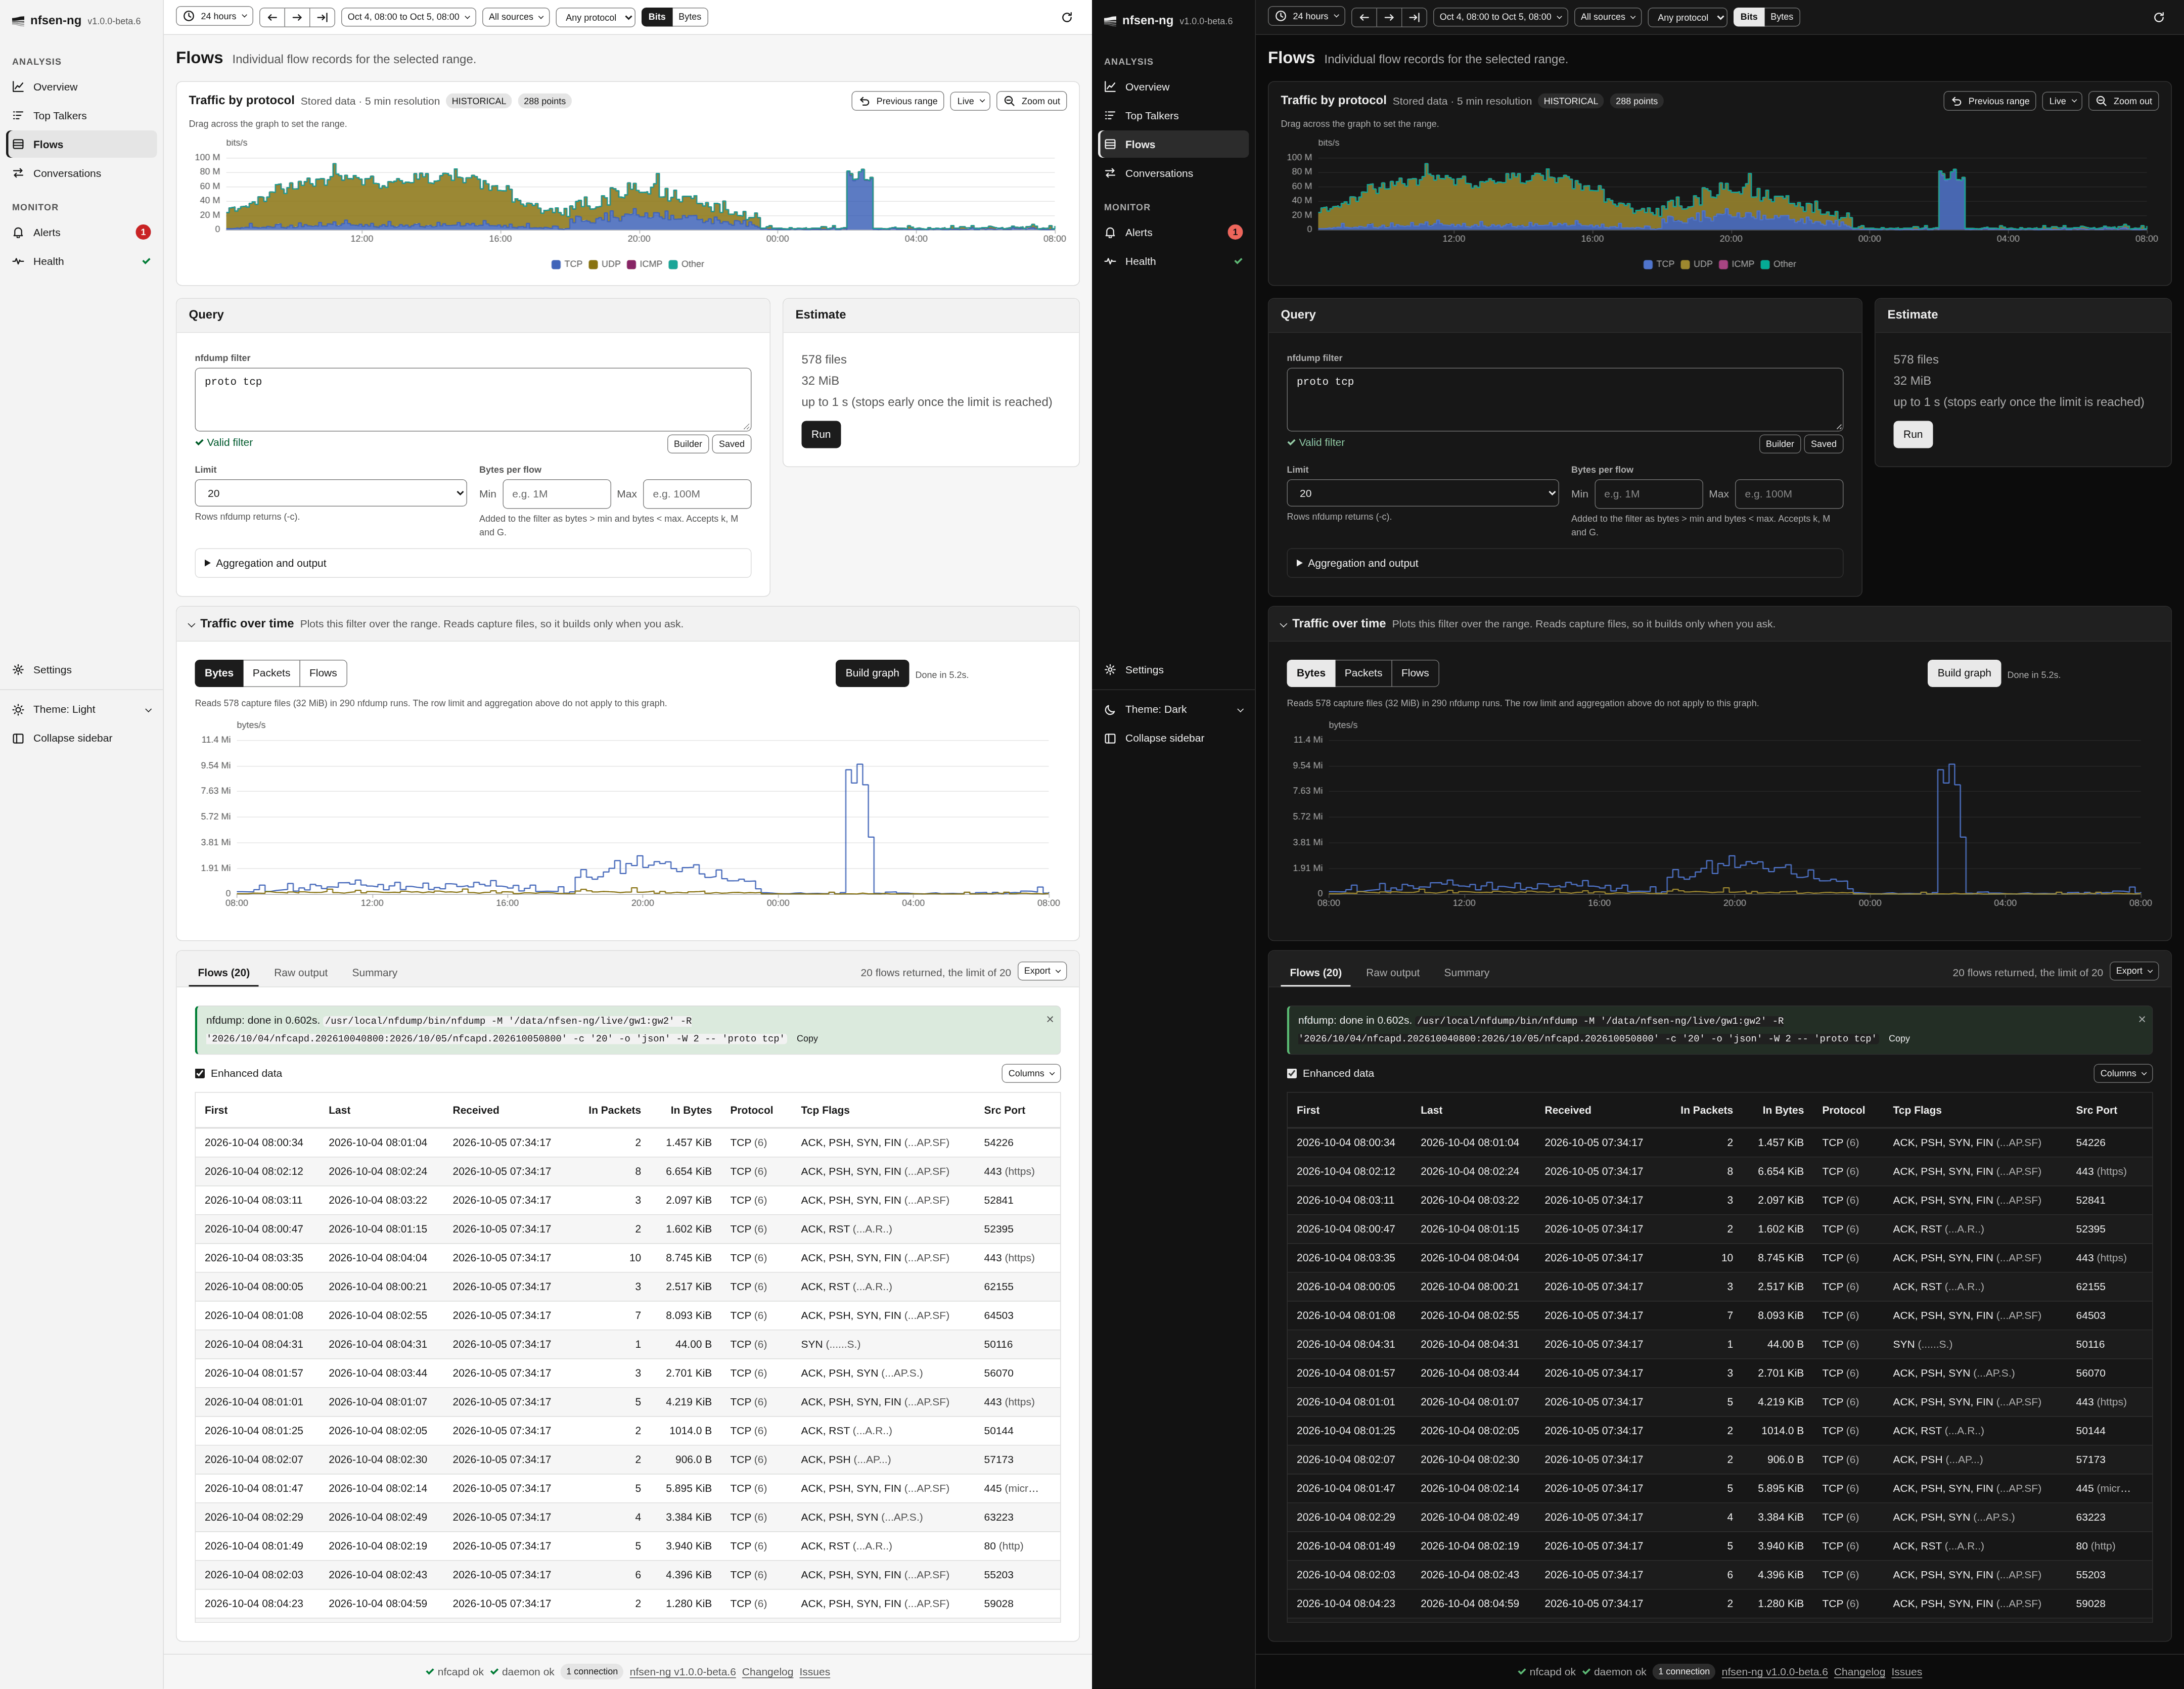
It answers “when did this happen” without describing the query twice. The graph uses the filter you typed, including the byte limits, so it shows exactly the traffic the table lists. Pick Bytes, Packets or Flows above it. With several sources selected it draws one line per source, otherwise one per protocol.
Two things it states on screen. The row limit and the aggregation do not apply to it, because they truncate and regroup the table rather than change which records match, so a table of 100 rows can sit beside a graph of every matching byte. And plotting a filter means reading capture files, one nfdump run per interval, so it never builds on its own: the section says what it would read and waits for Build graph. The runs go several at a time where the server allows more than one nfdump process, and Kill stops them all, keeping the intervals that finished.
If the query or the window moves after a build, the section says so and keeps the graph it built.
Conversations
Conversations shows who talks to whom: the busiest source and destination pairs of the range, drawn three ways from one query. The widest band, the darkest cell and the first row are the same conversation.
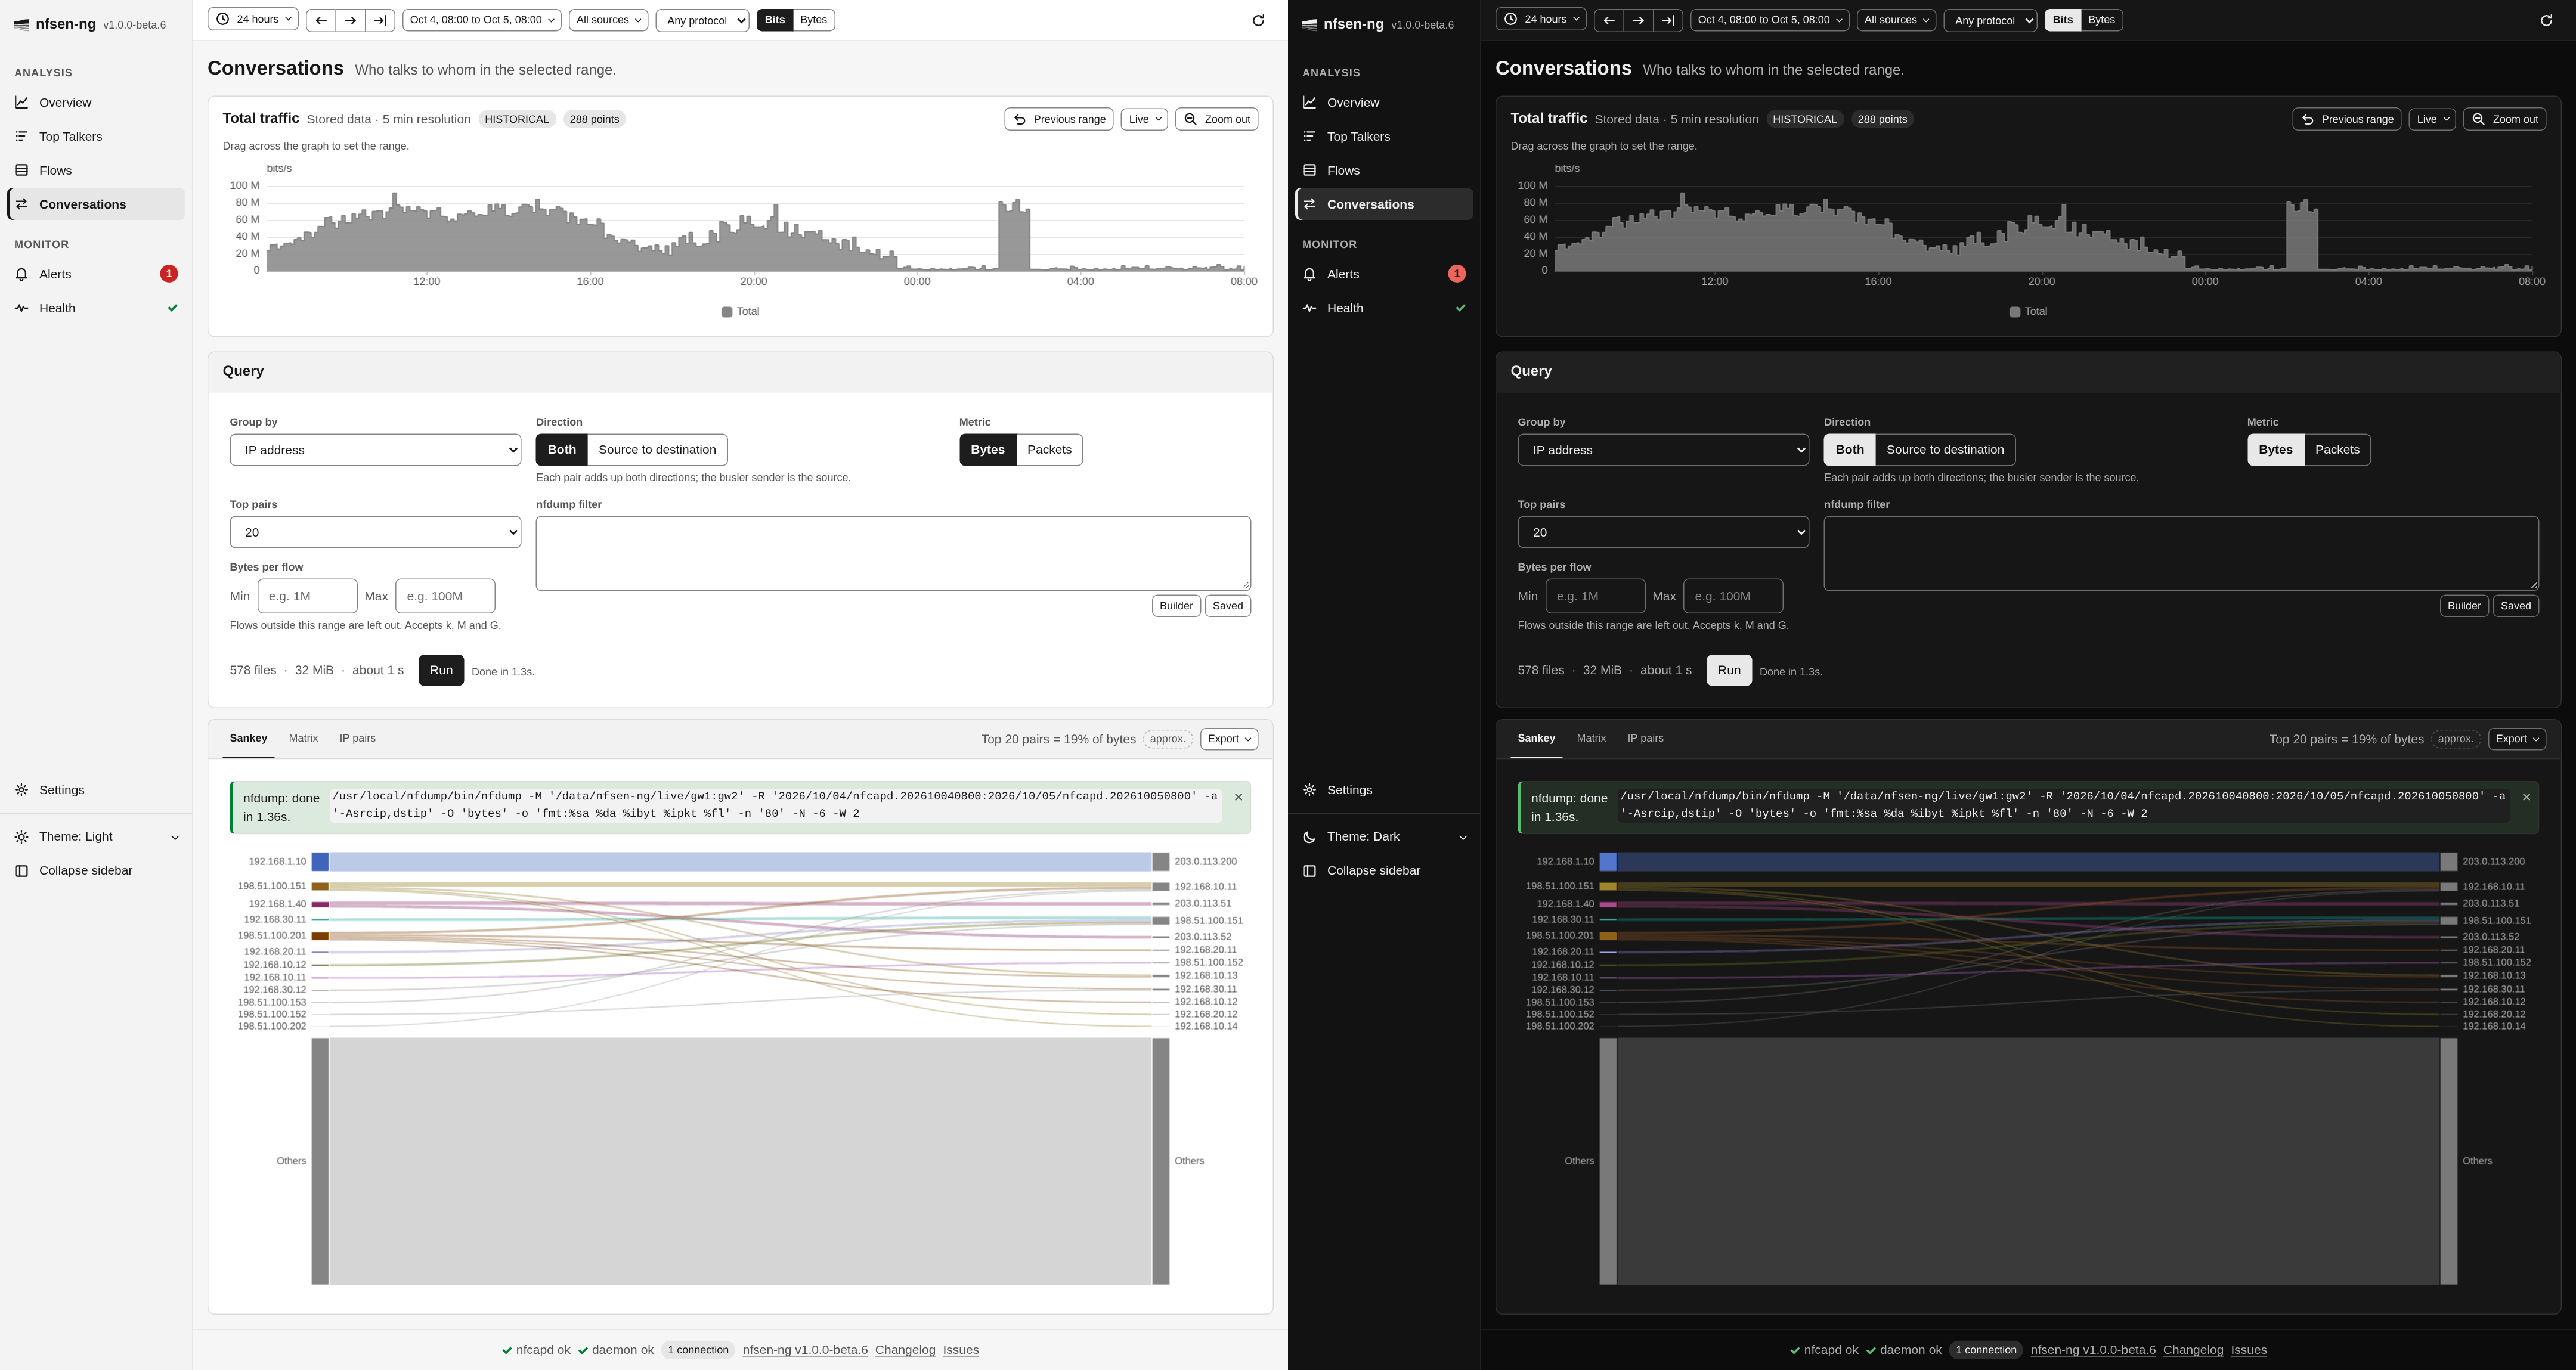
When to reach for this instead of Top Talkers
Top Talkers ranks addresses one side at a time: “top 10 source IPs” and “top 10 destination IPs” are two separate lists. Conversations shows the relationship between them, which sources drive traffic to which destinations, without cross-referencing two tables yourself.
Running a query
| Control | What it does |
|---|---|
| Group by | IP address, /24 subnet, /16 subnet, or Destination port (source IP to port to destination IP) |
| Direction | Both adds up both directions of each pair; Source to destination keeps each direction as its own pair |
| Metric | Rank and size by Bytes or Packets |
| Top pairs | How many pairs to show: 10, 20, 50, 100 or 200 |
| nfdump filter | Any nfdump filter, checked as you type |
| Bytes per flow | Leave out flows below Min or above Max bytes (accepts k, M and G) |
The range, the sources and the protocol come from the controls bar. Check the estimate and press Run.
A few combinations have rules. Both is not available with Destination port, because a port belongs to one direction. With Both, the busier sender of a pair becomes its source; nfsen-ng merges the directed pairs itself, from four times as many as you asked for (at most 2000), so a pair near the end of a long list can miss part of its reverse traffic, and the summary line then carries an approx. badge. Subnet grouping covers IPv4 only, and the card says so.
Past a certain count the Sankey gets crowded rather than more useful, so start with 10 or 20 pairs and widen only if you need to.
Reading the result
The line above the views sums up the result, e.g. Top 20 pairs = 64% of bytes. The tabs switch between three views of the same pairs.
Sankey draws each pair as a band from its source to its destination, as wide as its bytes or packets. The traffic outside the top pairs becomes an Others node in each column, so the diagram accounts for all the traffic the query matched. Click an address to look it up.
With Destination port, the Sankey gets a middle column: source IP → port →
destination IP. That answers which service a conversation used, e.g. that one
host’s traffic to a server is all 443 while another’s is 22. The port column
pools traffic per port, so a busy port shows up as one thick node fed by every
source and fanning out to every destination that used it. ICMP has no ports;
its flows appear as ICMP type.code, such as ICMP 8.0 for echo requests.
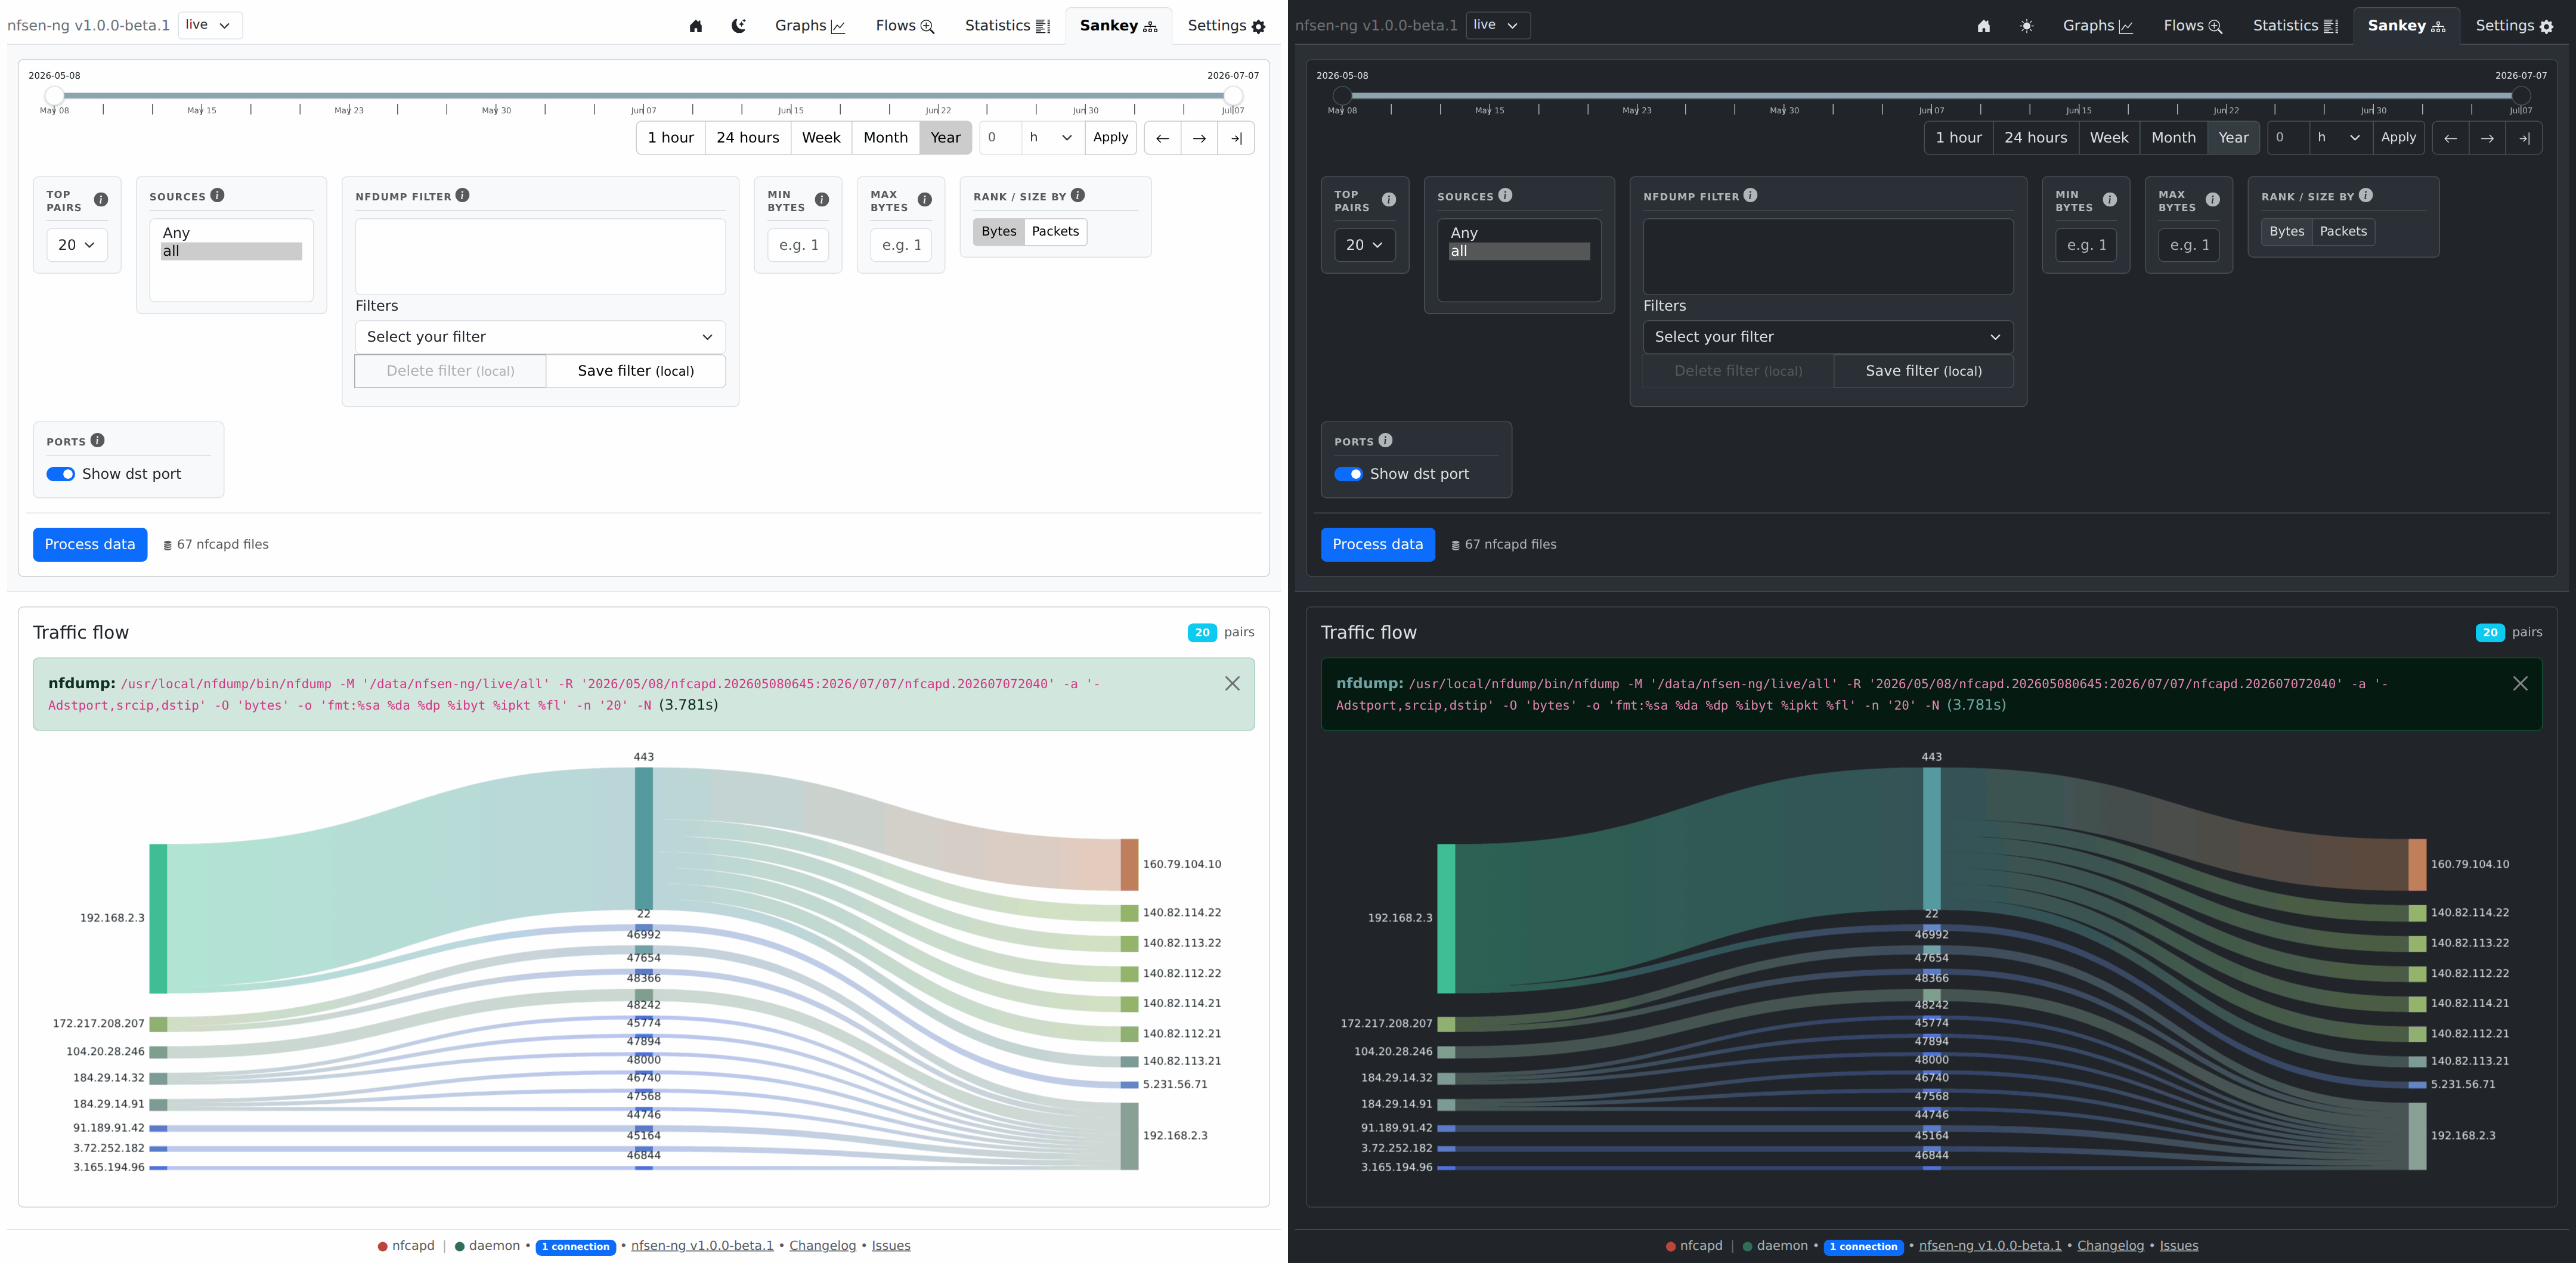
Matrix puts the sources on one axis and the destinations on the other, with a darker cell for more traffic. A hatched cell is a pair outside the top pairs: its traffic is unknown, not zero. Point at a cell for the figures.
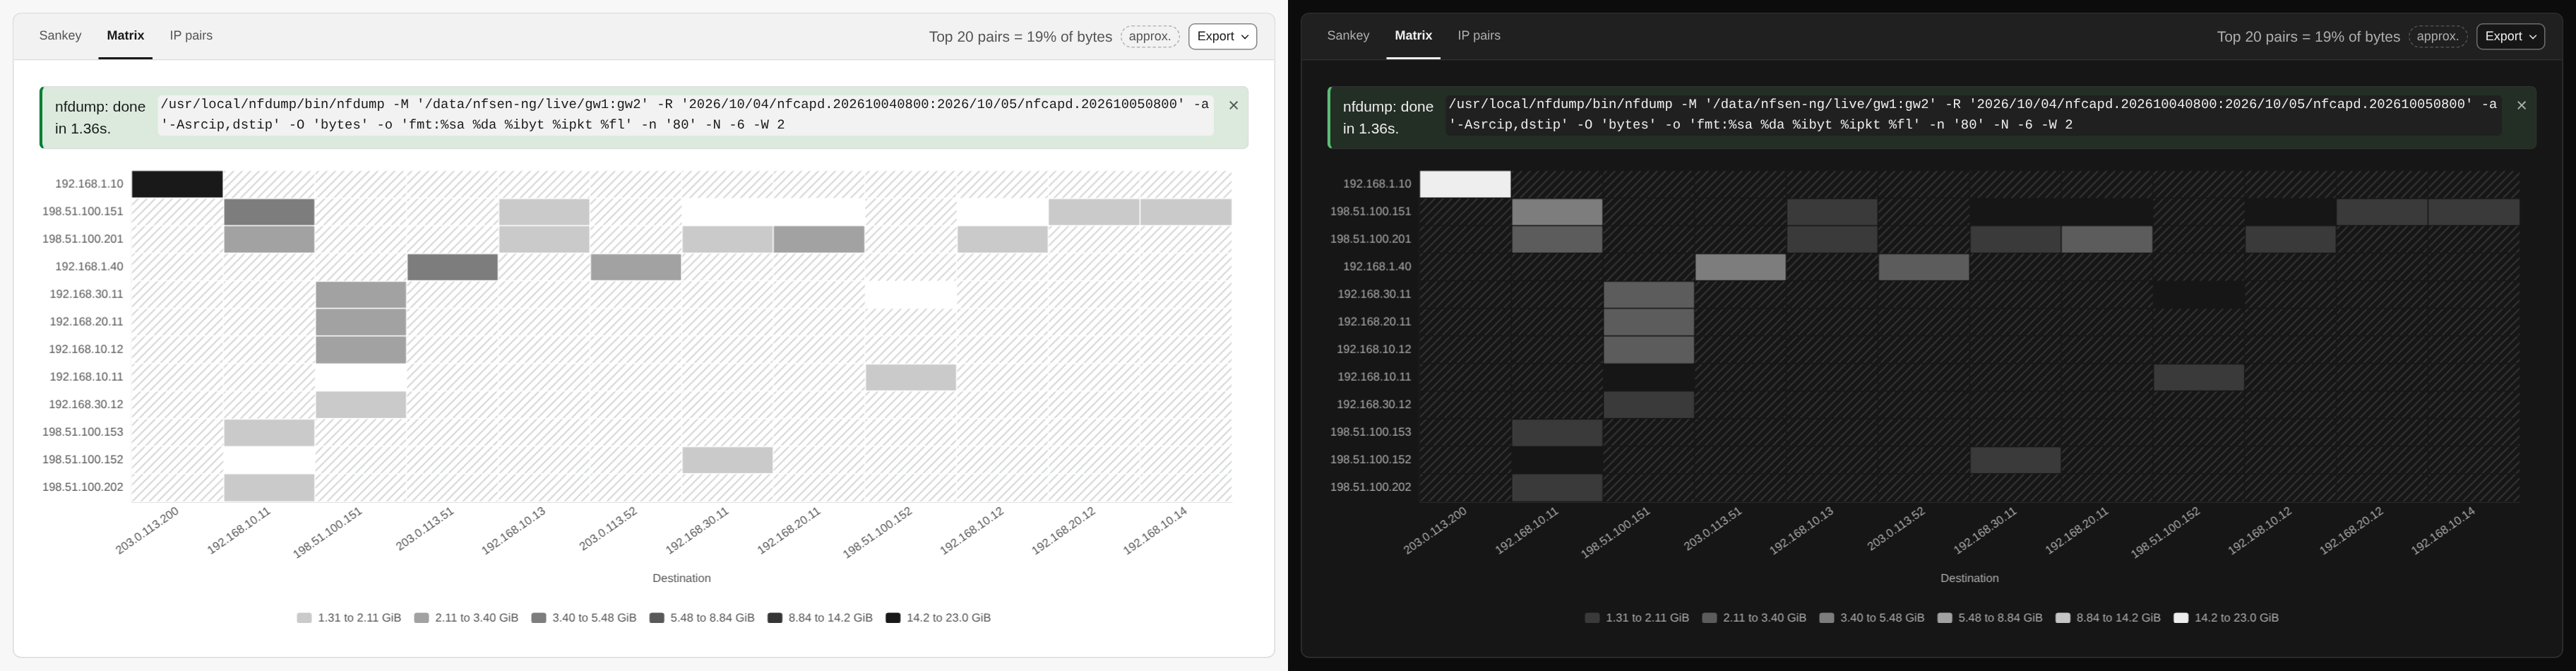
IP pairs is the ranked table, with bytes, packets, flows and each pair’s Share of the total. Below it, Others sums up the traffic outside the top pairs. Addresses link to the IP lookup.
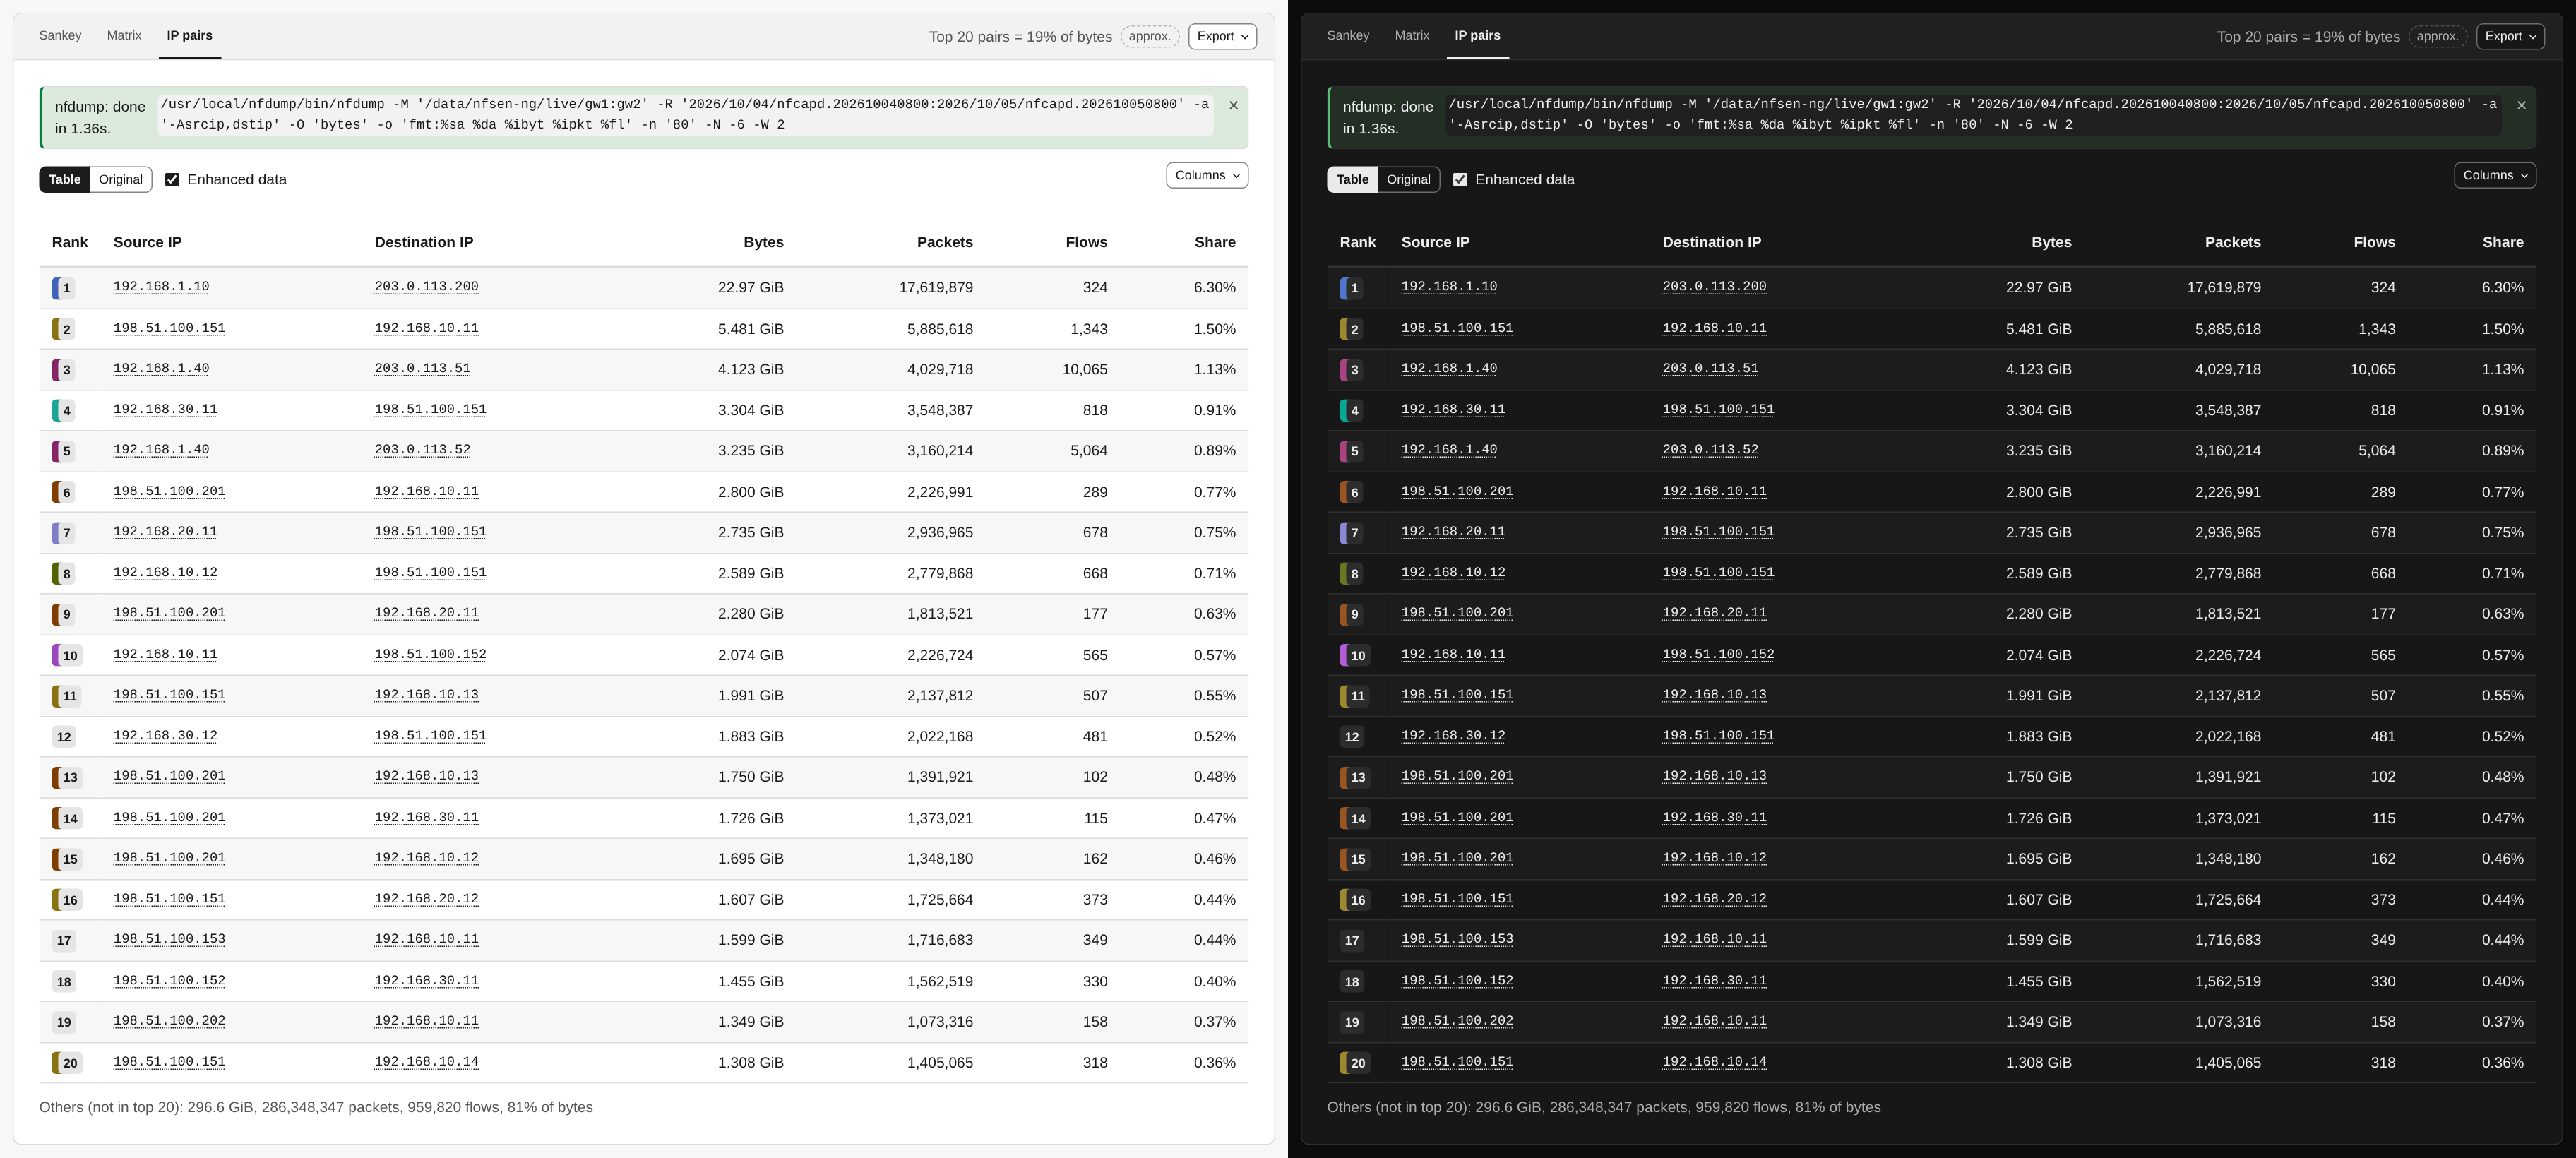
Exporting
Export offers the IP pairs as CSV or JSON, a PNG of the Sankey or the Matrix (whichever is open), and Copy nfdump command. The exported Share is a percentage with Enhanced data on, and the raw fraction with it off.
Filter builder
Every nfdump filter field has two buttons under it, Builder and Saved. Both open the filter builder, a drawer over the page that edits that field: the filter of a filtered graph on Overview, of Top Talkers, Flows or Conversations, or the traffic filter of an alert rule. Its title says which one, e.g. Filter builder for Flows.
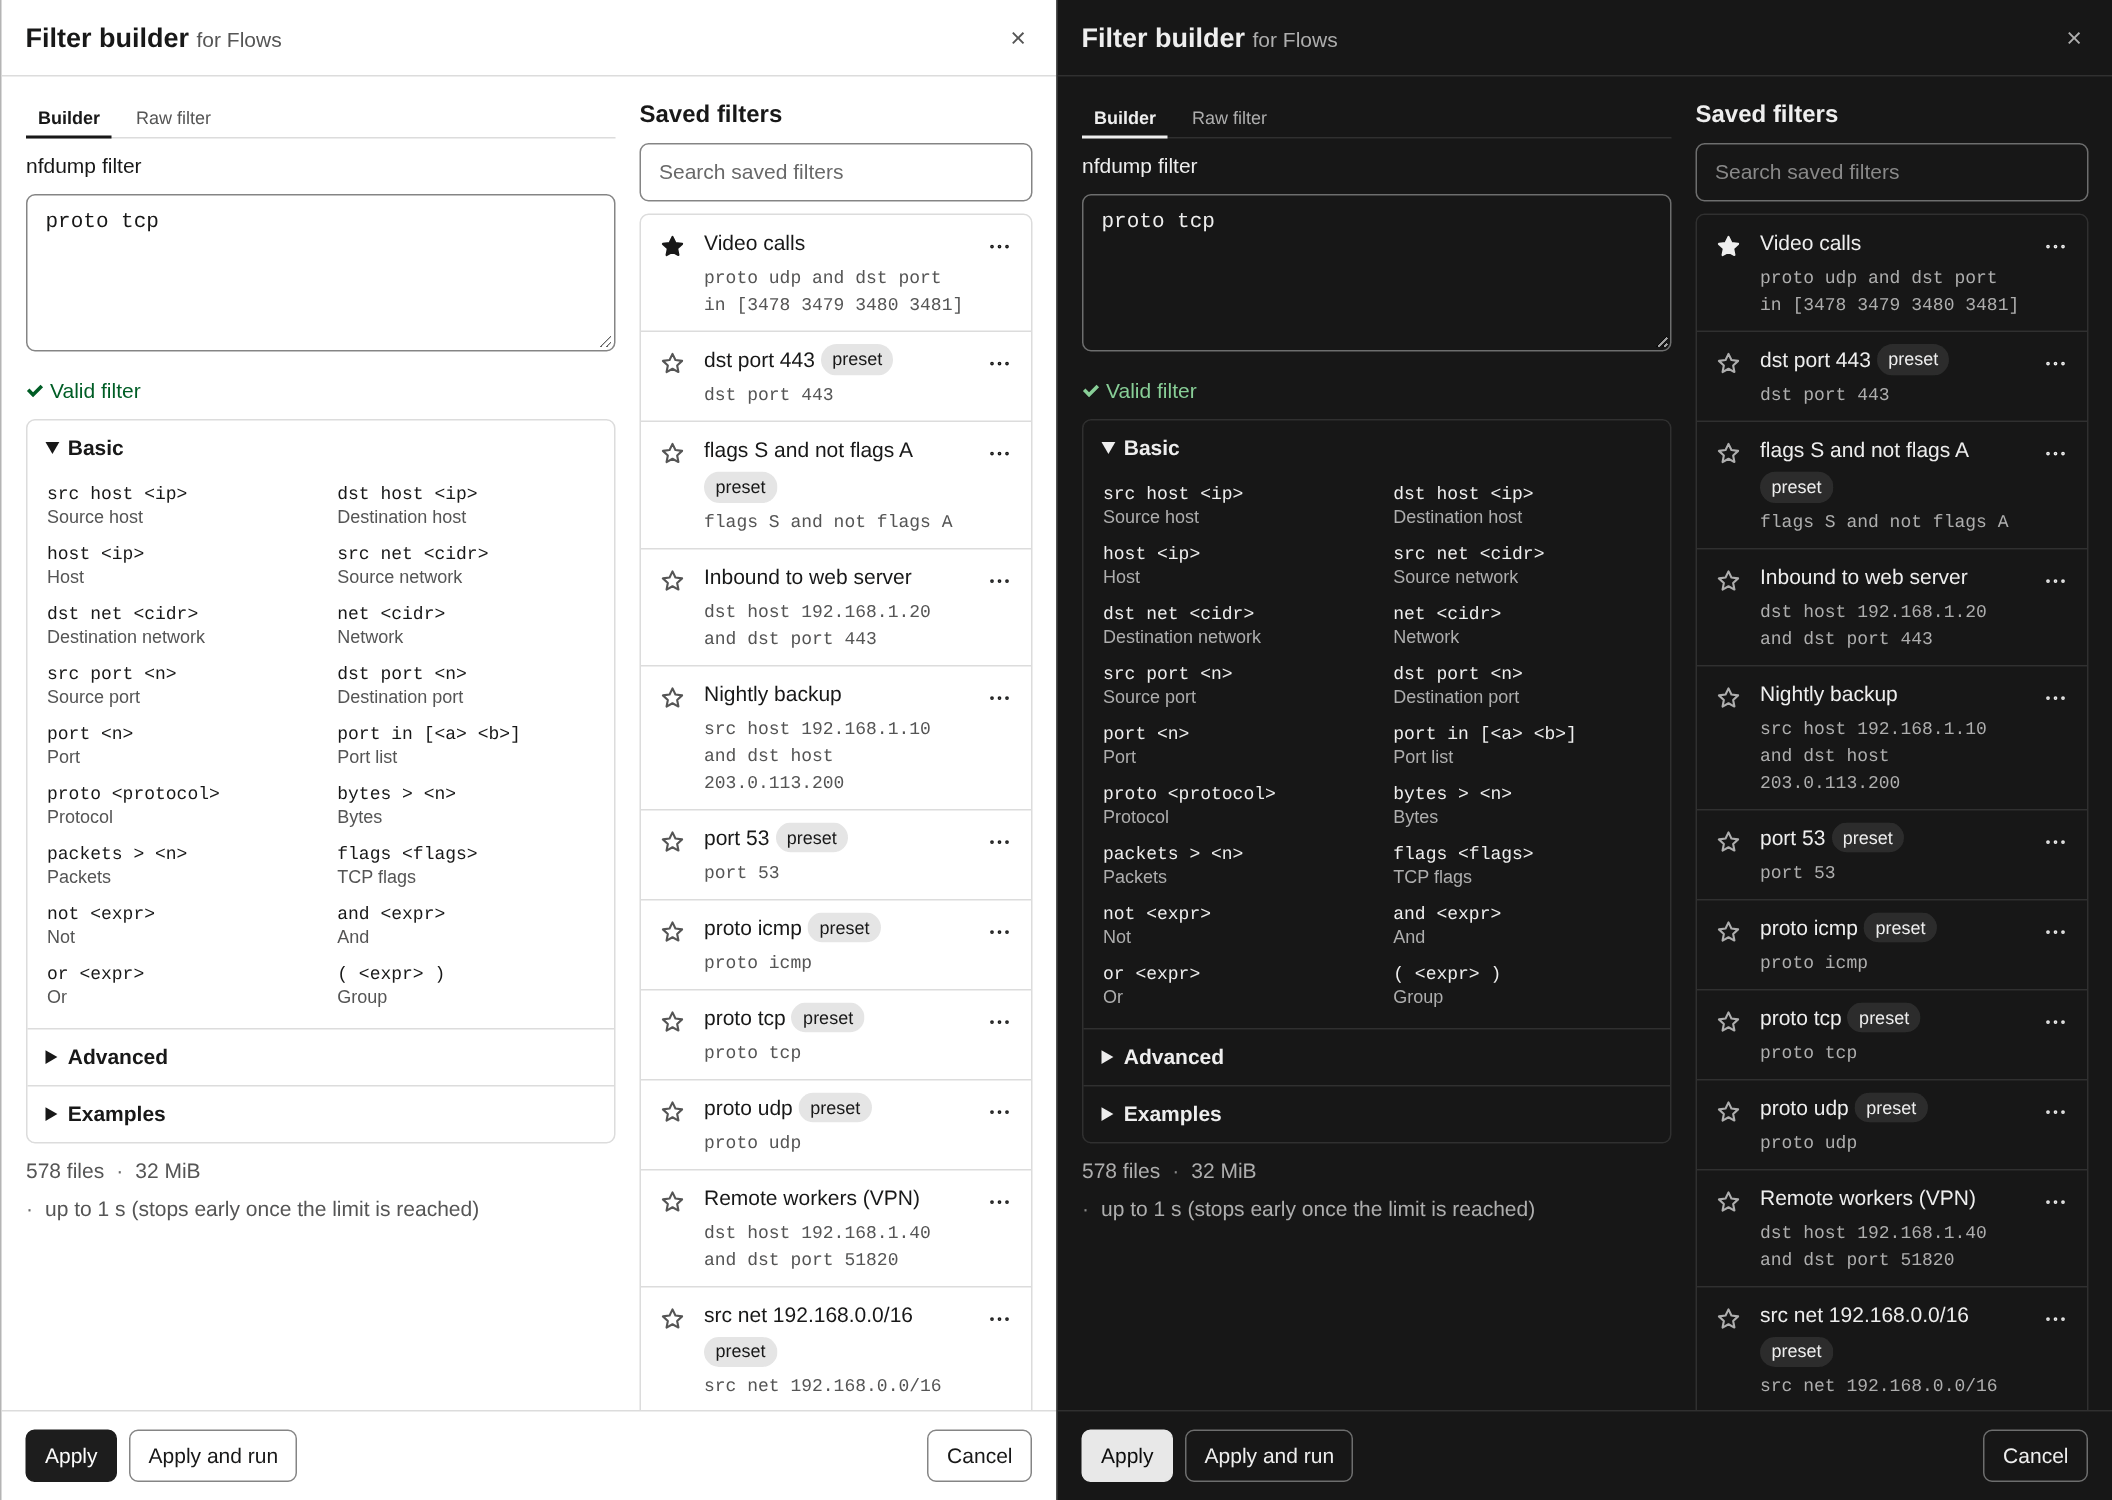
Writing a filter
The Builder tab has the filter text on top and a reference below it:
- Basic and Advanced list the fields and operators nfdump understands,
such as
src host <ip>,dst port <n>,proto <protocol>,net <cidr>,bytes > <n>orflags <flags>, each with a short description. Click one to insert it at the cursor. - Examples are complete filters for common questions, from Web traffic and DNS to TCP SYN without ACK. Click one to insert it.
- While you type, a list suggests the keywords that match the word at the cursor. Arrow up and Arrow down move through it, Enter or Tab takes a suggestion, Escape closes the list.
The words in angle brackets are placeholders. The first one is selected after inserting, so typing replaces it, and Tab selects the next one.
The Raw filter tab is a larger text area for long filters. Several lines are
one filter, and # starts a comment that runs to the end of the line.
Under the text, the filter is checked against nfdump itself a moment after you stop typing: Valid filter, or nfdump’s error message. When the builder edits a query, the drawer also shows that query’s estimate for the current range.
Applying
Apply writes the text into the field the drawer was opened for and closes it. Apply and run does the same and presses that page’s Run; an alert rule has no Run, so there the button is missing. Cancel, Escape or the close button leave the field as it was. The drawer keeps what you typed, though: open it again for the same field and it says Unapplied draft restored, with Discard draft to start from the field’s text instead.
Saved filters
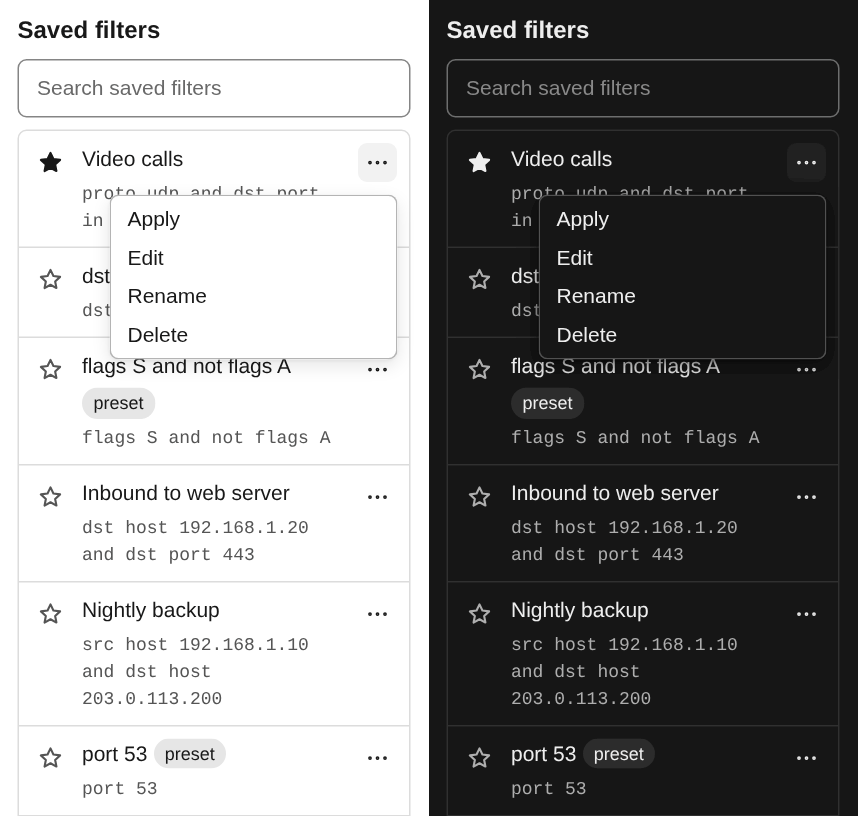
The right-hand side of the drawer lists the saved filters. The list lives on the server, in the SQLite store, so everyone who uses this nfsen-ng instance sees the same filters in every browser.
- Search narrows the list by name and expression.
- The star in front of a filter keeps it at the top: starred filters come first, then the ones used most recently.
- Each filter’s menu offers Apply (load it into the editor, from where the drawer’s Apply or Apply and run takes it into the field), Edit (load it into the editor to change it; Save changes then updates the saved filter), Rename (type the new name, Enter saves, Escape cancels) and Delete.
- Save current filter stores the text in the editor under the name you type, or under the filter itself if you leave the name empty. Each expression is saved once: saving one that differs only in spaces says Already saved as and names the filter you have.
Filters marked preset came from the deployment (NFSEN_FILTERS or
settings.php) or from the old Filter presets list in Settings. They behave
like any other saved filter, and a preset you delete stays deleted.
Filters from before the upgrade
Earlier versions kept saved filters in each browser. The first time a browser opens this version, the drawer imports that browser’s list into the saved filters, once; if the import fails, the browser tries again on the next load. The filter presets that were saved in Settings are moved into the list the first time the server reads it. See Upgrading.
Setting Up Alerts
Alerts watch a metric (flows, packets or bytes) and notify you when it crosses a threshold. They are checked automatically for every five-minute interval as the import brings it in, so nobody has to keep a browser open.
They live on the Alerts page:
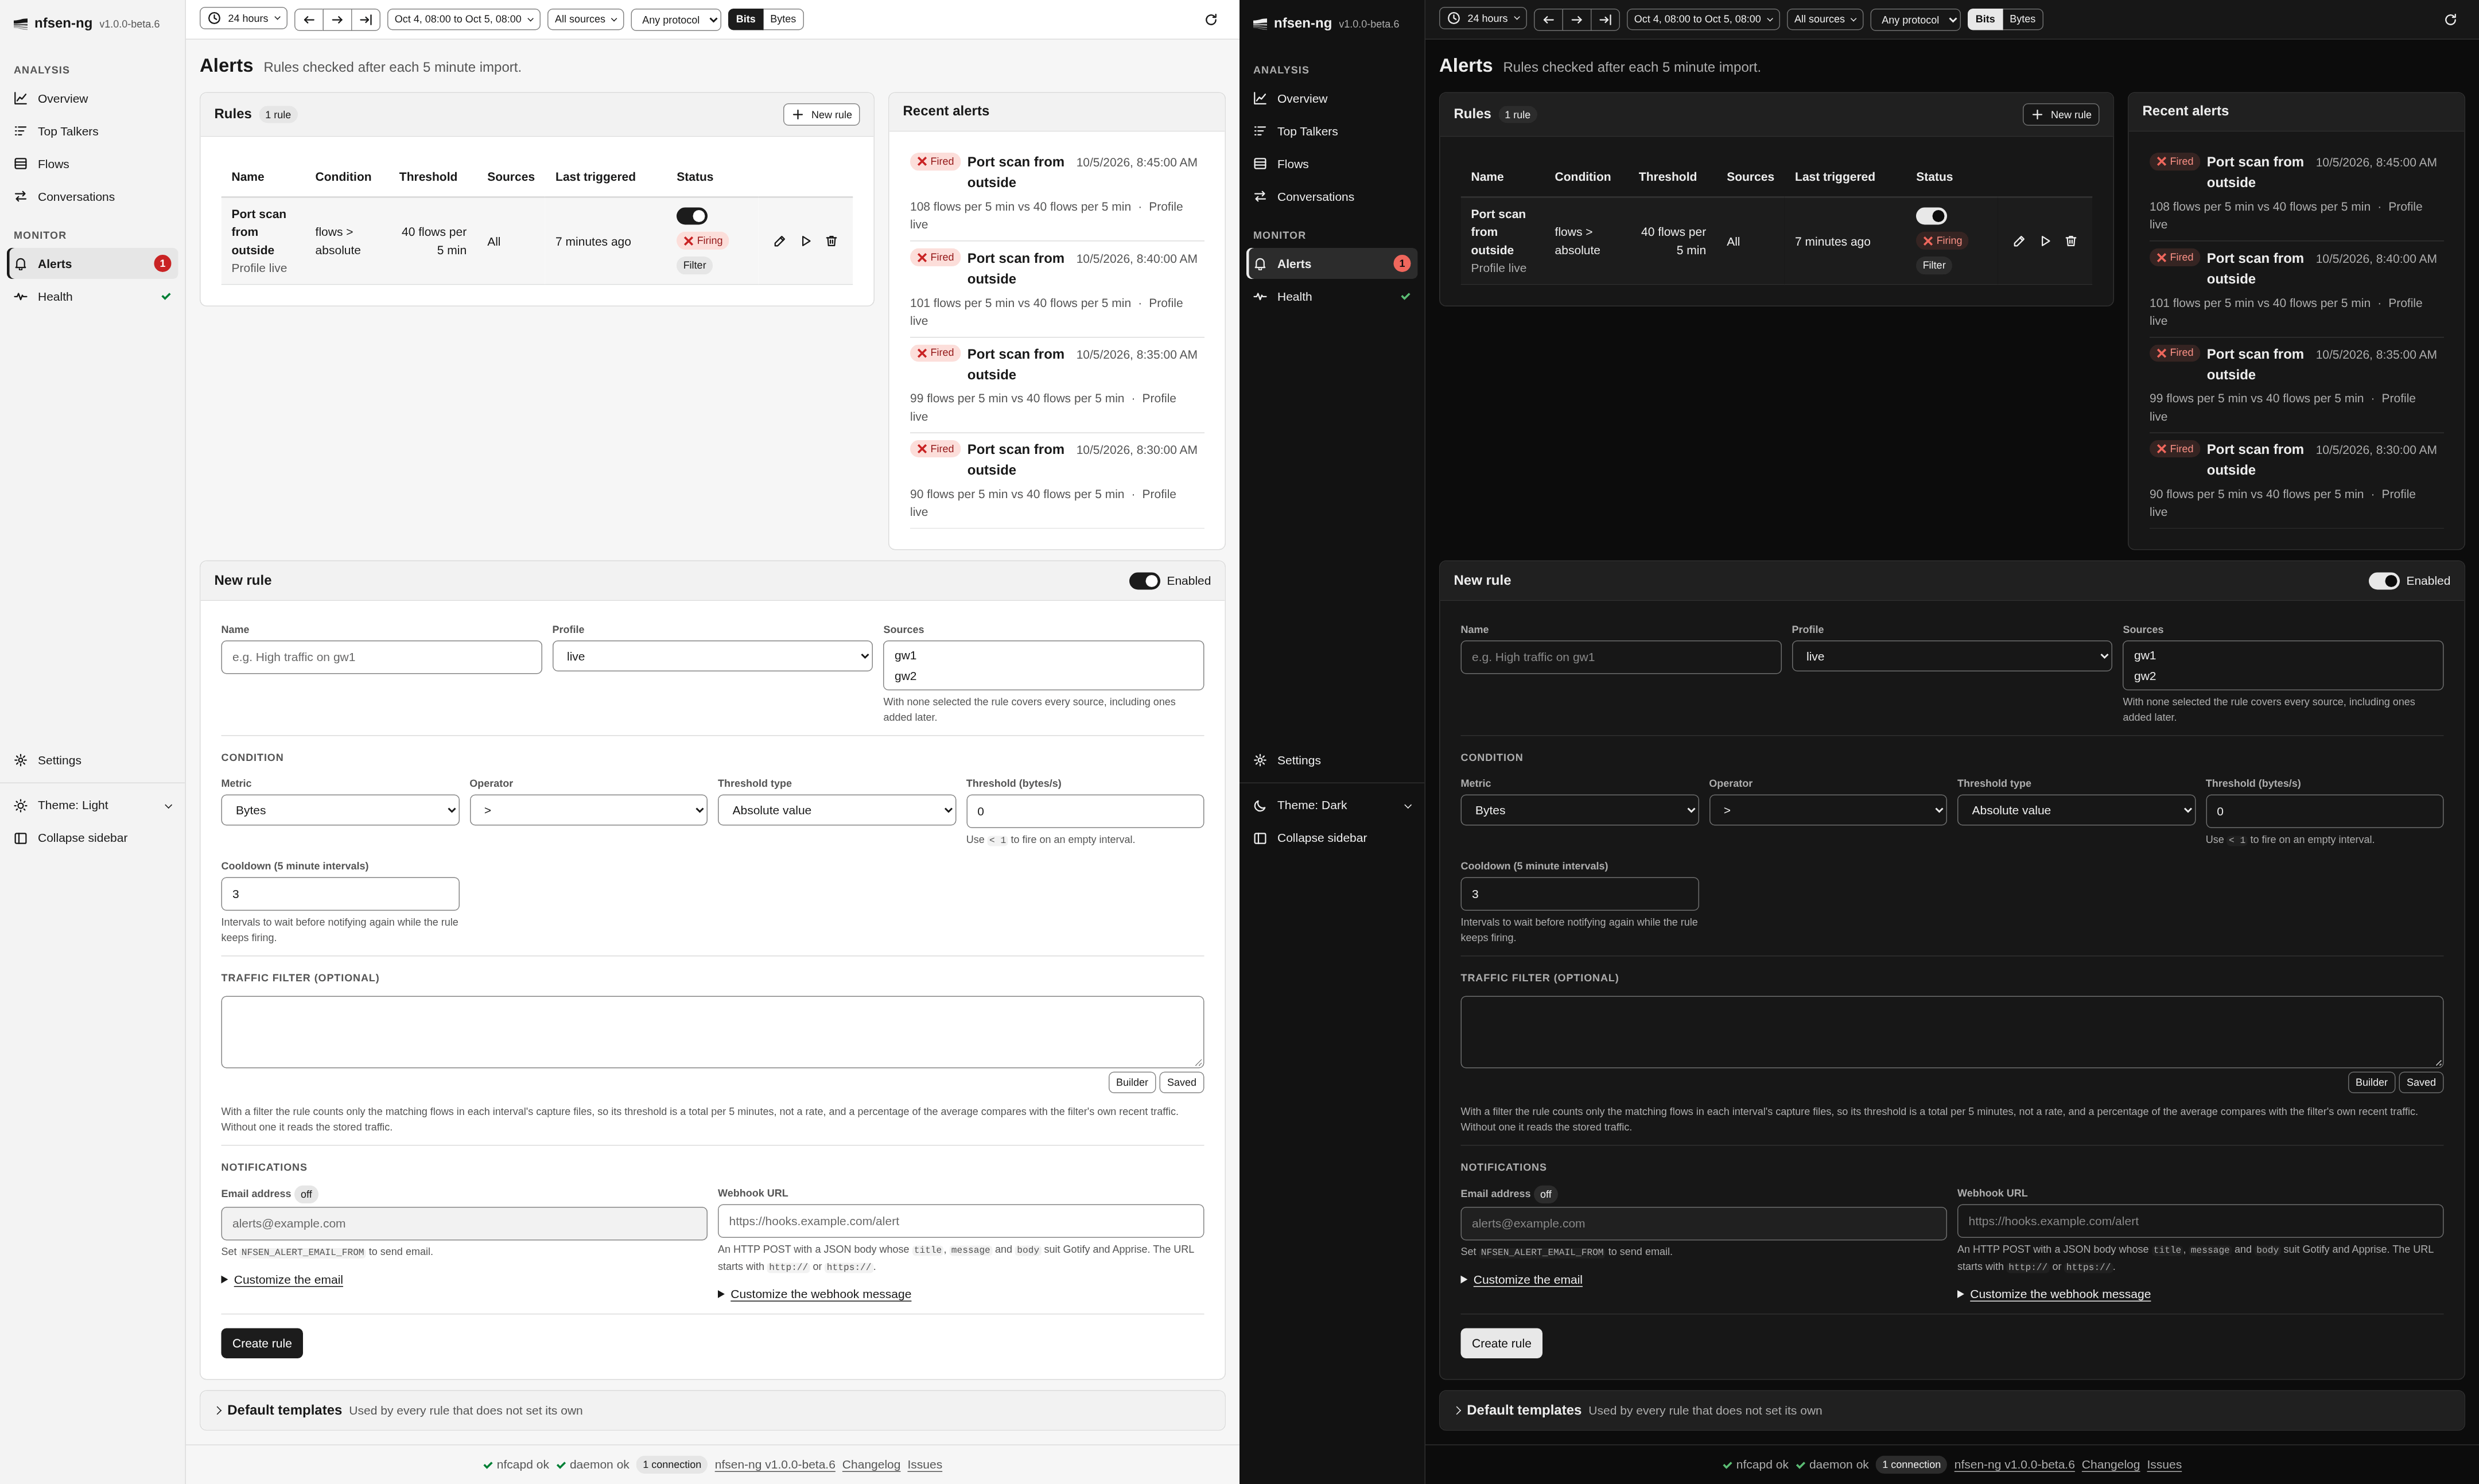
The Rules table lists every rule with its condition, threshold, sources, when it last fired (12 minutes ago, counting on while the page is open; point at it for the date and time), and a switch to turn it on or off. The status says OK, Firing or Disabled, and the sidebar shows how many rules are firing. Recent alerts beside it shows the last 50 events, newest first:
- Fired: the condition held for an interval (and a notification went out, unless the rule is in its cooldown).
- Resolved: a rule that had fired found the condition false again on a later interval. This is recorded but not notified.
- Test: somebody pressed Test on the rule.
Creating a rule
Press New rule and fill in the form below the table:
- Name: anything memorable, e.g. “High traffic on gw1”.
- Profile: which nfdump profile the rule watches (usually
live). - Sources: the exporters to add up. With none selected the rule covers every source, including ones added later.
- Condition: pick a Metric (Flows, Packets, Bytes), an Operator
(
>,>=,<,<=), a Threshold type and a value:- Absolute value: fire when the metric crosses this number. Use
< 1to fire on an empty interval. - % of rolling average: fire when the metric is this percent of its own average over the window you choose in Average over (10 min to 24 h), before the interval checked. Use this for “alert me when traffic is unusually high for this network” rather than a fixed number that might be normal for one link and alarming for another. A rule of this type waits until there is an average to compare with, and skips intervals while the average is zero.
- Absolute value: fire when the metric crosses this number. Use
- Cooldown (5 minute intervals): how many intervals to wait before notifying again while the rule keeps firing, so a sustained spike doesn’t flood you.
- Notifications: an email address and/or a webhook URL. Email works only
when the administrator set a sender address (
NFSEN_ALERT_EMAIL_FROM); the form says when it is off. Leave both empty for a rule that only shows up on this page.
The switch in the form’s header decides whether the rule starts enabled. Press Create rule. To change a rule, press its Edit button; the form fills in, the button says Update rule, and Cancel edit leaves the rule as it was.
Scoping an alert to specific traffic
By default a rule watches all traffic of its sources. Often you want something narrower: “alert only on ICMP”, “alert only for this subnet”. That is what the Traffic filter field is for:

Type any nfdump filter, the same syntax as on Flows; the field checks it against nfdump as you type, and Builder and Saved open the filter builder. A rule with a filter nfdump rejects cannot be saved.
| You want to watch | Traffic filter |
|---|---|
| Only ICMP traffic | proto icmp |
| Only one subnet | net 192.168.1.0/24 |
| Traffic from one subnet, TCP only | src net 10.0.0.0/8 and proto tcp |
With a filter, the rule runs a small nfdump query over the interval’s capture files and counts only the matching flows. Its value is then a total per five minutes, not a rate, so set the threshold accordingly. Without a filter it reads the stored series, which is cheaper and all you need for a general high-traffic alert.
With a filter, % of rolling average compares with the filter’s own recent traffic, not with all traffic: at every check, an enabled rule records how much its filter matched in that interval, and averages those records. So:
- A new or edited rule has no average yet. It starts comparing after it has checked one interval, and its average covers the full window only once it has run that long. Changing its profile, sources, filter or metric starts the average over.
- A rule has no average while its filter matched nothing in the window. A rule
that should fire on traffic that is normally absent (any ICMP on a quiet link)
needs an Absolute value instead, such as
> 0. A below rule that is firing stays firing while its filter matches nothing. - Alerts such a rule recorded before this version show their old threshold labelled as a total per five minutes; that threshold was a per-second average of all traffic.
When rules are checked
Every rule is evaluated once per five-minute interval and profile, as soon as every source has delivered its capture file for that interval, in whatever order the files arrive. A source that has nothing waiting once a later interval is in counts as down and is left out until it reports again, so one dead exporter does not stop the rules of the others.
Customizing the notification text
By default, email and webhook notifications use a fixed subject/title and body/message. You can override this, for example to phrase Gotify or Apprise notifications your own way, or to put the actual traffic numbers into the message.
There are three levels, checked in order: a rule’s own override (if set), then a global default (if set), then the built-in text shown as each field’s placeholder.
Global defaults apply to every rule that doesn’t set its own override. Open Default templates below the rule form, edit, and save them there:
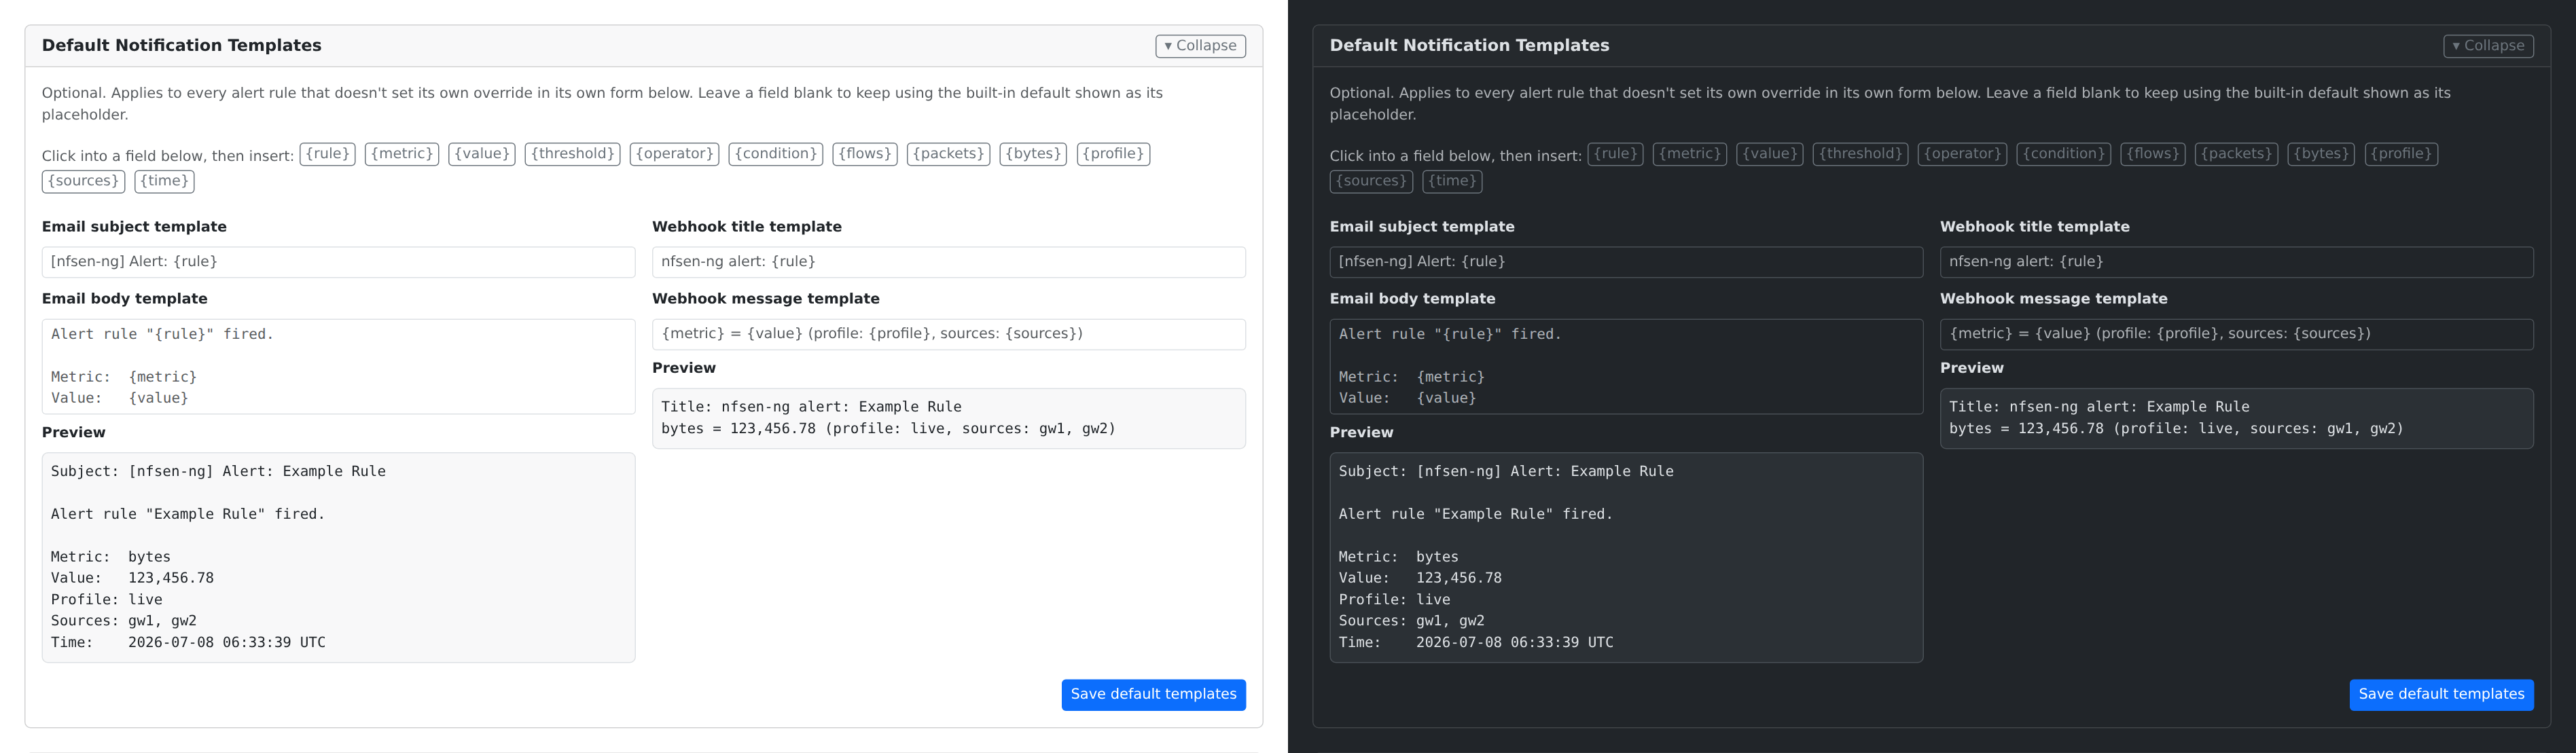
Per-rule overrides live in the rule form, folded behind Customize the email and Customize the webhook message under the email address and the webhook URL:
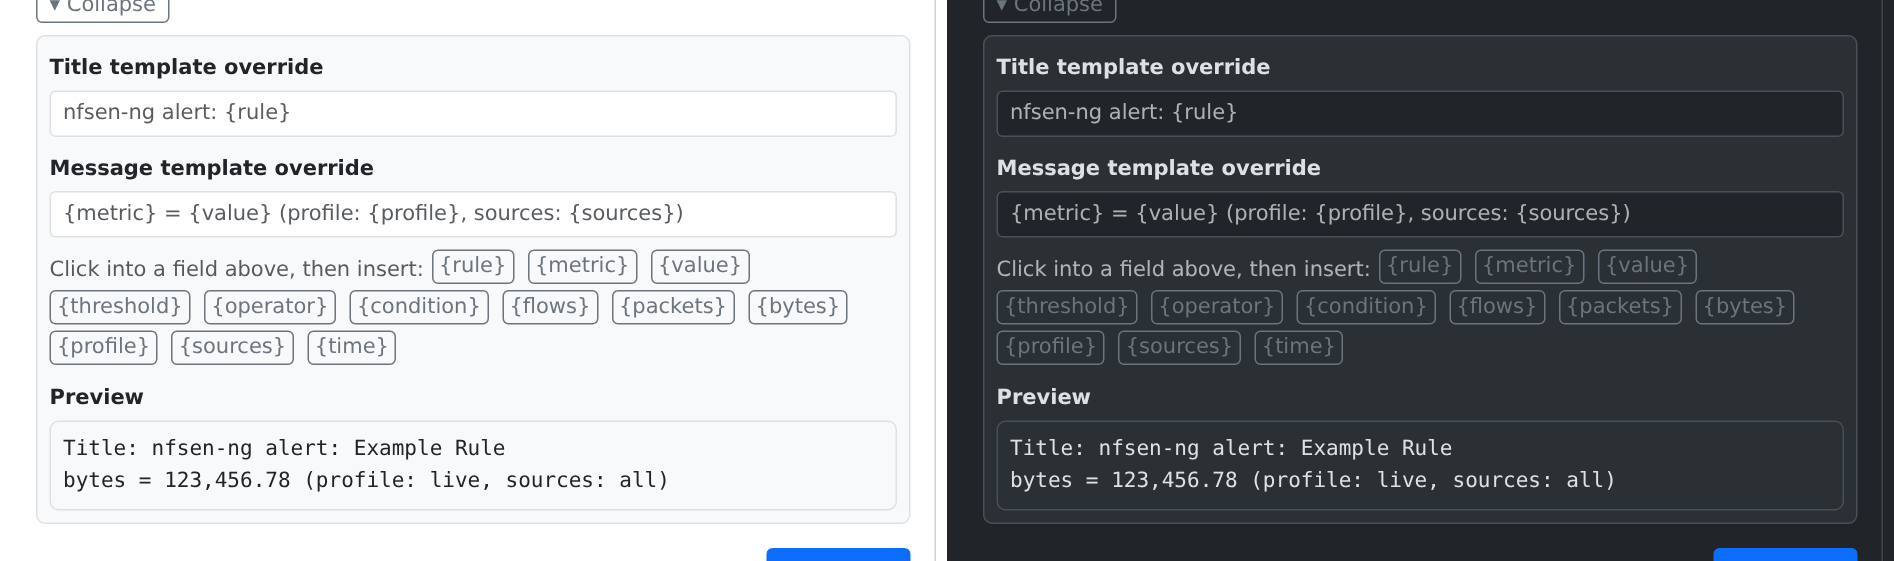
Either way, click into a template field, then click one of the variable buttons to insert it at your cursor:
| Variable | Value |
|---|---|
{rule} | Rule name |
{metric} | Which metric fired (flows, packets, or bytes) |
{value} | That metric’s value in the interval |
{threshold} | The threshold that was crossed |
{operator} | The comparison operator (>, >=, <, <=) |
{condition} | {metric} {operator} {threshold}, combined |
{flows}, {packets}, {bytes} | All three counters, regardless of which one the rule watches |
{profile} | The nfdump profile |
{sources} | The rule’s sources, comma-separated; all configured sources when the rule has none selected |
{time} | The start of the data interval that fired, in UTC |
The Preview under each pair of fields updates as you type, using made-up example numbers: it previews the template, not a real alert. To see the real text for a rule, use Test.
Testing before you rely on it
Test in a rule’s row evaluates it right away against the newest complete interval, with the same sources the live evaluation would use (a source that is down is left out), and opens a dialog with the answer:
- Would fire or Would not fire, with the value and the threshold it was compared with, or why there is none yet;
- what happened with each notification channel: Sent (the email with its
address), Failed with the reason (the webhook’s HTTP status, for example),
Not configured, or Not sent because the rule would not fire. An email
address on a server without a sender (
NFSEN_ALERT_EMAIL_FROM) shows as not configured on this server. Test waits up to ten seconds for the webhook to answer; - the start of the interval it tested;
- the email subject and body and the webhook title and message, rendered with the real figures.
A test that fires sends the notification for real, so you can check the email or the webhook receiver too. It is recorded as a Test event and does not touch the rule’s firing state or cooldown. Test a rule after creating or editing it, especially one with a traffic filter, before trusting it to notify you unattended.
Health
The Health page is for keeping nfsen-ng itself running: whether the import keeps up, whether every exporter still delivers, how full the disks are, and a checklist of the whole setup with advice for anything that is not green. The sidebar dot next to Health shows the worst check result on every page.
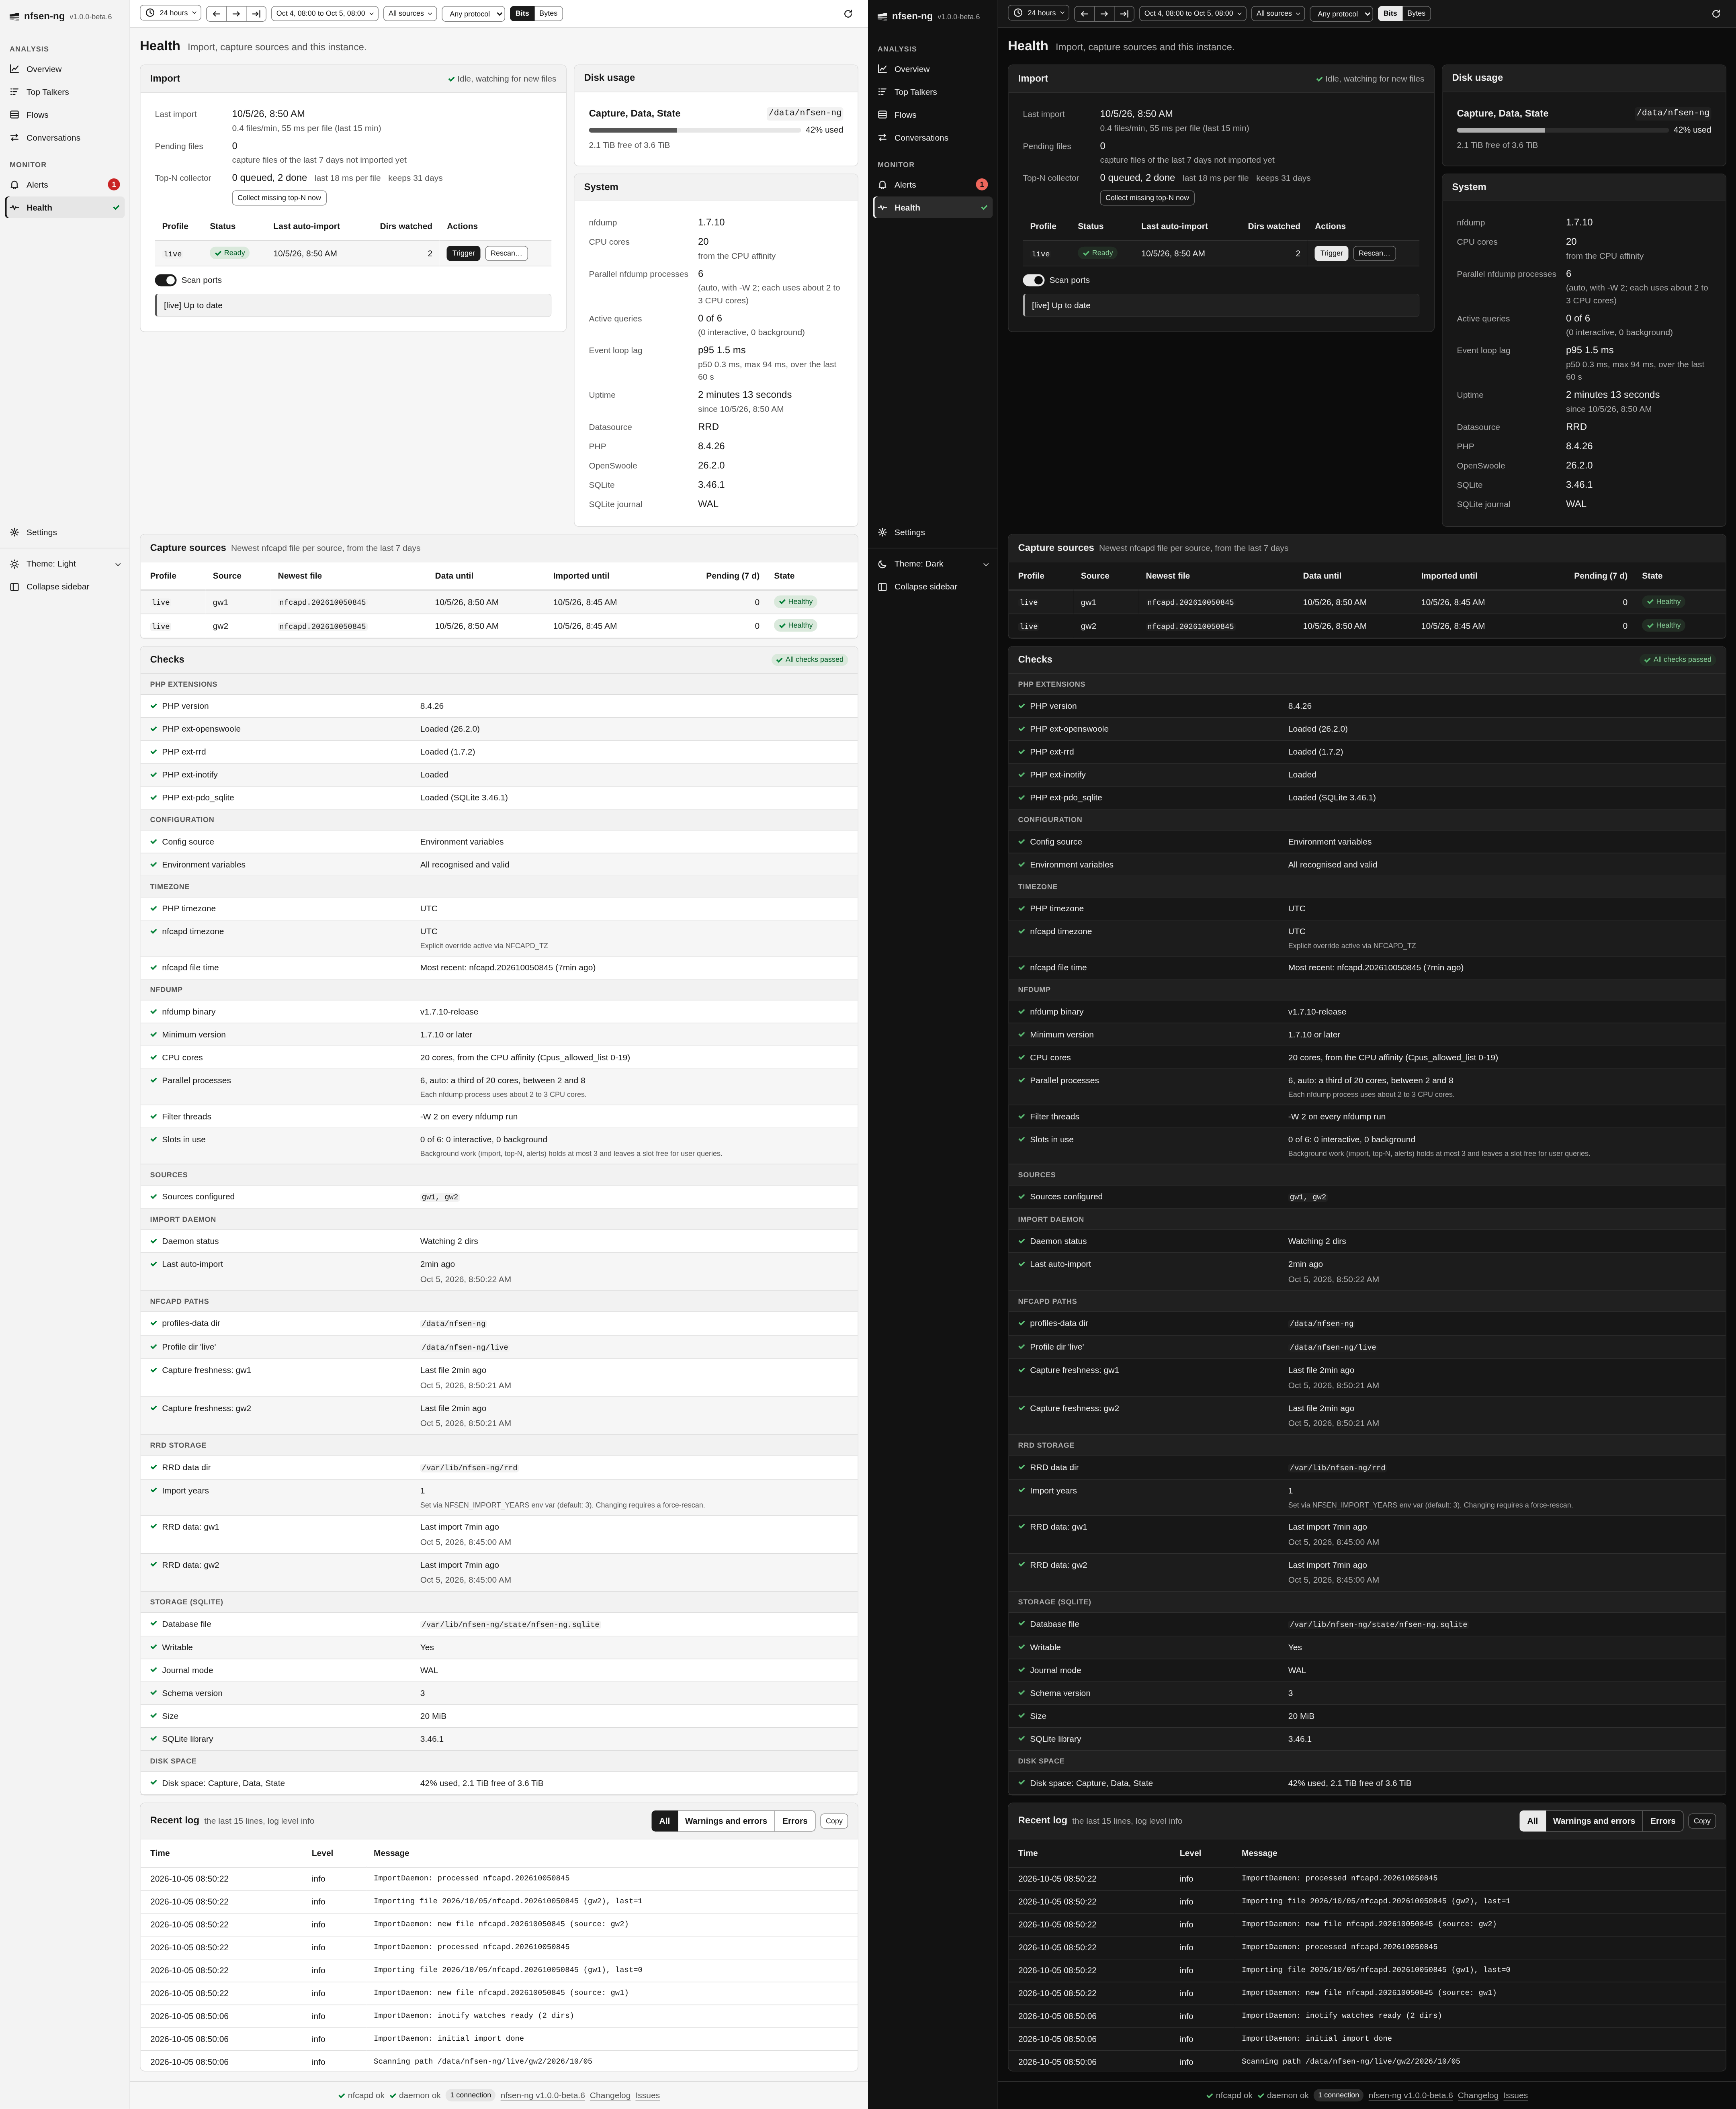
While the page is open it refreshes every 10 seconds. The checks themselves are recomputed in the background at most every 30 seconds, so opening the page never waits for them.
Import
The Import card says whether the import daemon is running, idle and watching
for new files, starting, or disabled (NFSEN_SKIP_DAEMON). Below that:
- Last import, with the rate of the last 15 minutes in files per minute and milliseconds per file.
- Pending files: capture files of the last seven days that are not imported yet.
- Top-N collector: how many capture files wait for their top-N lists or are being collected, how many are done or failed, the time the last one took, and how many days are kept. Collect missing top-N now looks for intervals of the retention window that have no lists yet and queues up to 500 of their files at once, and more as those are done, instead of waiting for the collector’s next pass. See Overview for what the lists are for.
The table lists each nfdump profile with its daemon status, its last automatic import and how many directories it watches. New nfcapd files are picked up and imported as they are written, so you normally never press anything here. Three buttons exist for when you need to step in:
- Trigger re-runs the catch-up import for the profile. Use it after pointing nfsen-ng at a directory with history it has not seen, or when you suspect it missed something.
- Backfill (VictoriaMetrics) re-reads every capture file, including those
older than the newest sample already stored, and writes each one to the slot
it belongs to. Nothing is deleted. Use it for an archive of
nfcapdfiles that predates the install: a normal Trigger starts at the newest sample and never looks behind it. It reads the whole archive, so it takes a while. - Rescan (RRD) resets the profile’s stored data and re-imports everything from scratch. This is destructive and asks for confirmation first; use it only if the data looks wrong and Trigger doesn’t fix it.
Which of the last two you see depends on the datasource. RRD files are written in time order and RRDTool refuses an update at or before the file’s last update, so filling in history means rebuilding the file. A VictoriaMetrics sample is addressed by its timestamp, so an old capture can be written where it belongs, and a destructive reset would be pointless there.
Scan ports decides whether a manual pass also rebuilds the per-port series. While a pass runs, the card shows its progress, the time left and the current file, the controls bar shows an import chip, and Cancel import stops it. Warnings and errors of the last pass are listed under Import log, the newest 100 of them, with the count of all (3 warnings, 1 error, the last 100 shown).
Capture sources

Capture sources has one row per profile and source: the newest capture file, the time its data reaches, how far it is imported, how many files of the last seven days wait, and a state:
- Healthy: a new file arrived in the last 12 minutes.
- Stale: no new file for more than 12 minutes. The exporter or nfcapd stopped.
- No data: no capture file in the last seven days.
- Missing: the source directory does not exist.
Disk usage and system
Disk usage shows how full the filesystems are that hold the capture files, the RRD data and the state directory (with the SQLite store); directories on the same filesystem share a row. It turns to a warning at 85 % and an error at 95 %, since nfcapd, the import and the SQLite store fail once a disk is full. VictoriaMetrics data lives elsewhere and is not measured.
System lists the nfdump version, the CPU cores nfsen-ng may use and where
that number came from, Parallel nfdump processes (for example 6 (auto, with
-W 2; each uses about 2 to 3 CPU cores) on 20 cores), Active queries (1 of 6
(1 interactive, 0 background), plus how many wait), the Event loop lag, the
uptime, the datasource, and the PHP, OpenSwoole and SQLite versions with SQLite’s
journal mode. How many nfdump processes run at once is set by
NFSEN_NFDUMP_MAX_PROCESSES; see
nfdump processes and CPU cores.
Event loop lag says how late the server answers: one process serves every tab, and while it is busy with something (a render, a scan of a capture directory, a database write), every click, live update and timer waits. The row shows the p95, the median (p50) and the maximum delay over the last minute. A p95 of 100 ms or more gets the warning sign, 1 s or more the error sign; either means the server is too busy for its tabs, usually during a large import or backfill.
Checks
Checks runs down the setup in groups, each entry marked OK, Warning or Error, with a note on what to do about anything that isn’t OK:

- PHP Extensions: the PHP version and the extensions nfsen-ng needs,
including
pdo_sqlite. - Configuration: environment variables that are invalid, deprecated or
unknown (typos), a
settings.phpin use, and settings that contradict each other. - Timezone: the PHP timezone,
NFCAPD_TZ, and nfcapd file time, which warns when the newest file’s name is far from the time it was written, the usual sign of a wrongNFCAPD_TZ. - nfdump: the binary; Minimum version, a warning below 1.7.10 whose note
says what the installed version lacks (the security fixes of 1.7.9, or the
Bi-directional pairing that gcc builds of 1.7.8 and 1.7.9 get wrong); CPU
cores, Parallel processes and Filter threads (the
-Wpassed to every run); and Slots in use, how many nfdump processes run right now, for user queries and for background work. - Sources, Import Daemon and nfcapd Paths: the configured sources, the daemon, and each capture directory with its freshness.
- RRD Storage or VictoriaMetrics: the datasource.
- Storage (SQLite): the database file, whether it is writable, its journal mode, schema version and size, and the SQLite library version. The journal mode says Rollback journal (DELETE) where the filesystem refused WAL, which FUSE mounts such as Unraid’s user shares can do. Everything works in that mode; reads wait while a write runs.
- Disk space: the same filesystems as the Disk usage card.
Recent log
Recent log keeps the server’s last 200 log lines in memory, at the log level set in Settings. Show All, Warnings and errors, or only Errors, and Copy them for a bug report.
Settings
Settings has five tabs. General holds the preferences you can change from the browser; Sources, Storage, Integrations and System show how this instance is deployed, and apart from one switch they are read-only.
General
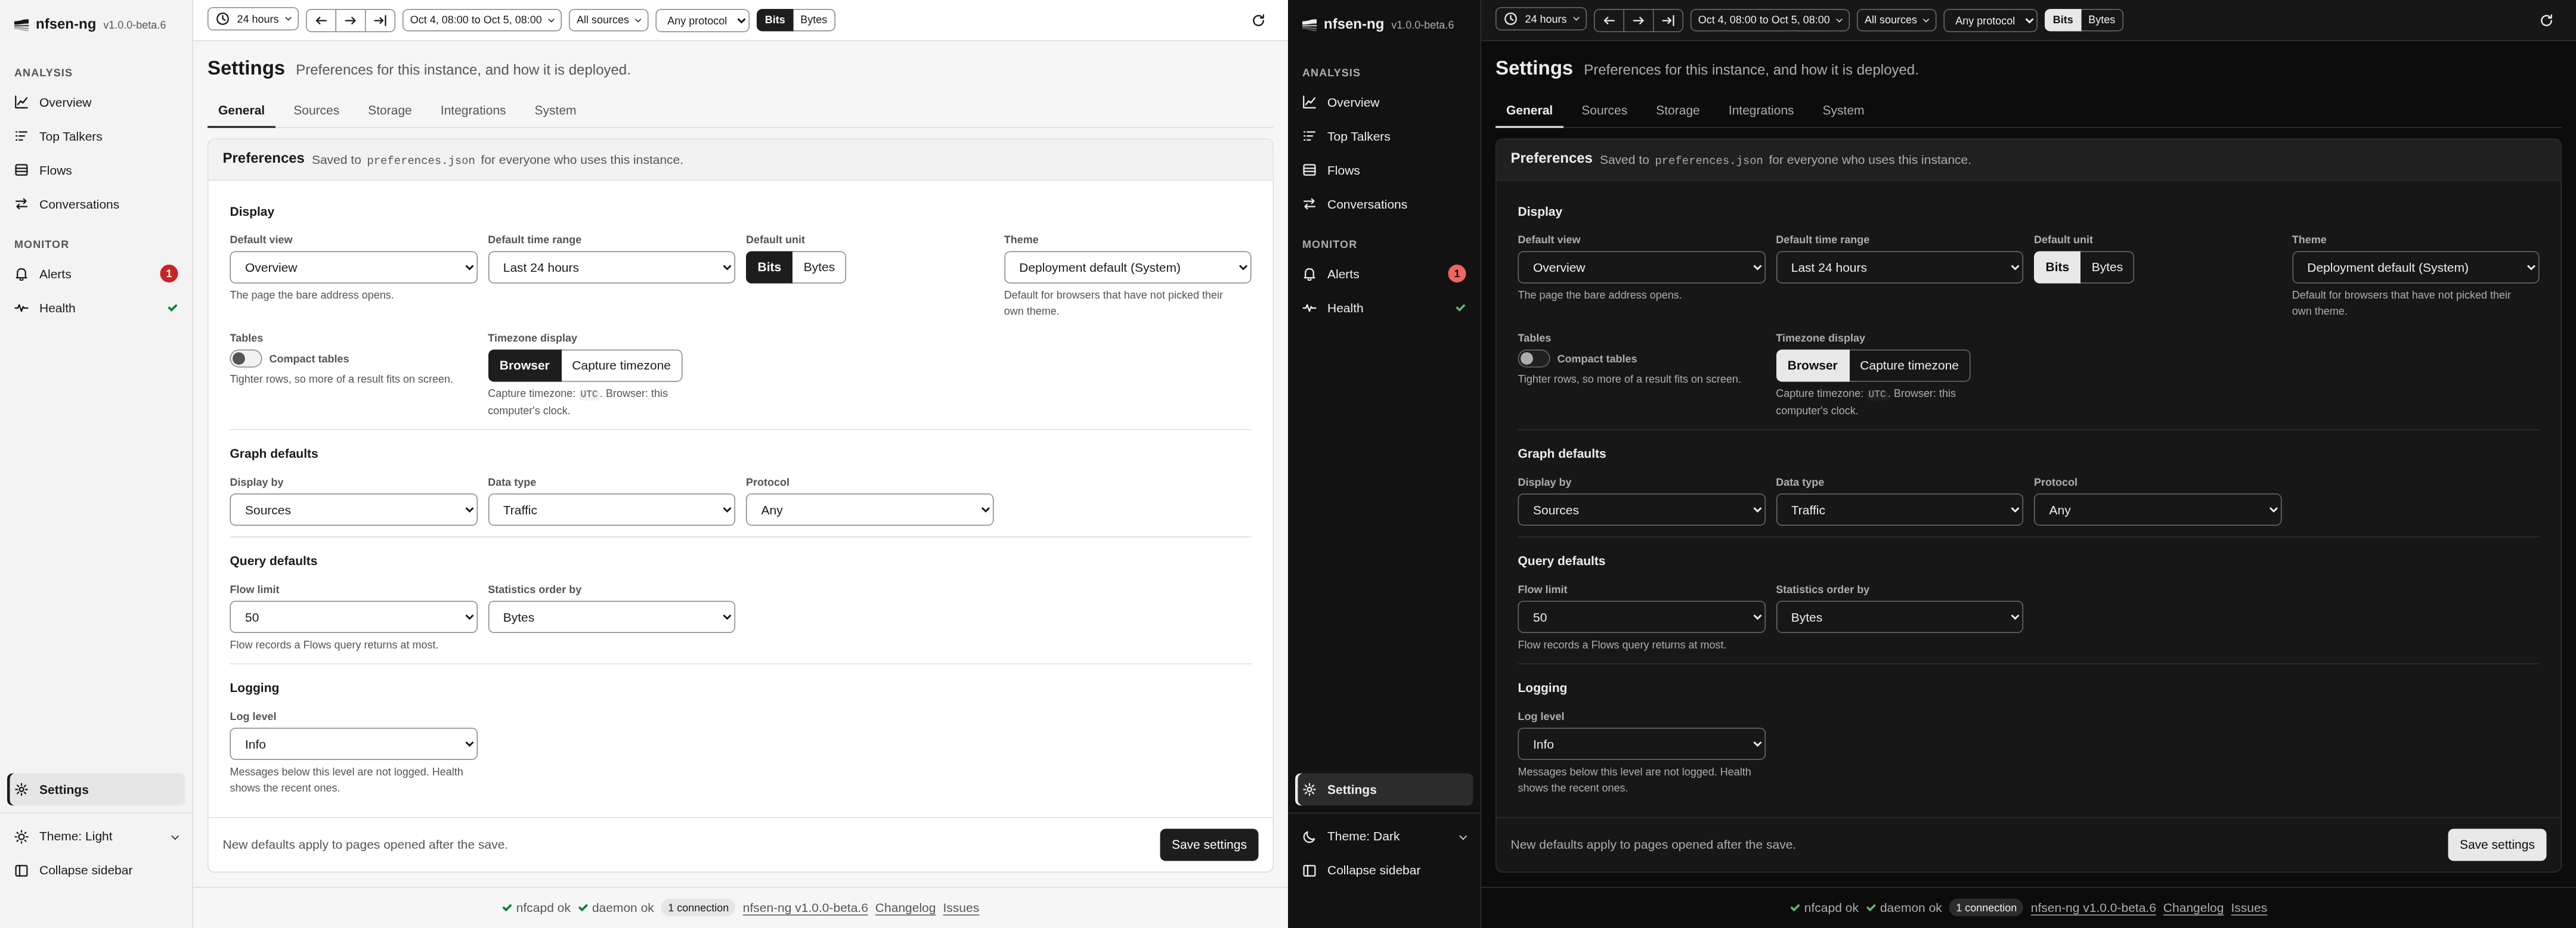
These preferences are saved to preferences.json on the server, so they apply to
everyone who uses this instance, in every browser. Save settings at the bottom
saves the whole tab.
Display
- Default view: the page that opens when the address has none.
- Default time range: the range a new tab starts with, from Last hour to Last year.
- Default unit: Bits or Bytes for rates and volumes.
- Theme: the theme for browsers that have not picked their own in the
sidebar. Deployment default uses what the administrator set
(
NFSEN_DEFAULT_THEME, named in brackets); System follows each computer’s light or dark setting; Light and Dark force one. - Compact tables: tighter rows, so more of a result fits on screen.
- Timezone display: show times in each Browser’s timezone, or in the Capture timezone nfcapd names its files in. Handy if you monitor a network in another timezone than the one you are sitting in.
Graph defaults set what the Overview graph starts with: Display by, Data type, and the Protocol the controls bar starts with.
Query defaults set the Flow limit for Flows and the Statistics order by for Top Talkers.
Logging sets the Log level of the server. Leave it at the default unless
you’re troubleshooting; the Health page shows the recent lines. A
saved log level overrides NFSEN_LOG_LEVEL.
Saved filters are managed in the filter builder, not here.
Which theme you see
A browser’s own choice in the sidebar theme menu wins. Without one, the
Theme above applies, and while that is left at Deployment default,
NFSEN_DEFAULT_THEME does. Use instance default in the theme menu drops the
browser’s own choice again.
Sources and Storage
Sources lists the configured sources and ports, the port direction, the capture directory root, the default and the detected profiles, and every capture directory with its state.
Storage shows the datasource and where it keeps its data, the import depth, the state directory, the preferences and settings files, the top-N retention, and the SQLite store: its file, size, journal mode and schema version, or the problem that keeps it from working.
Both come from environment variables or settings.php and change only with a
restart; see Configuration.
Integrations
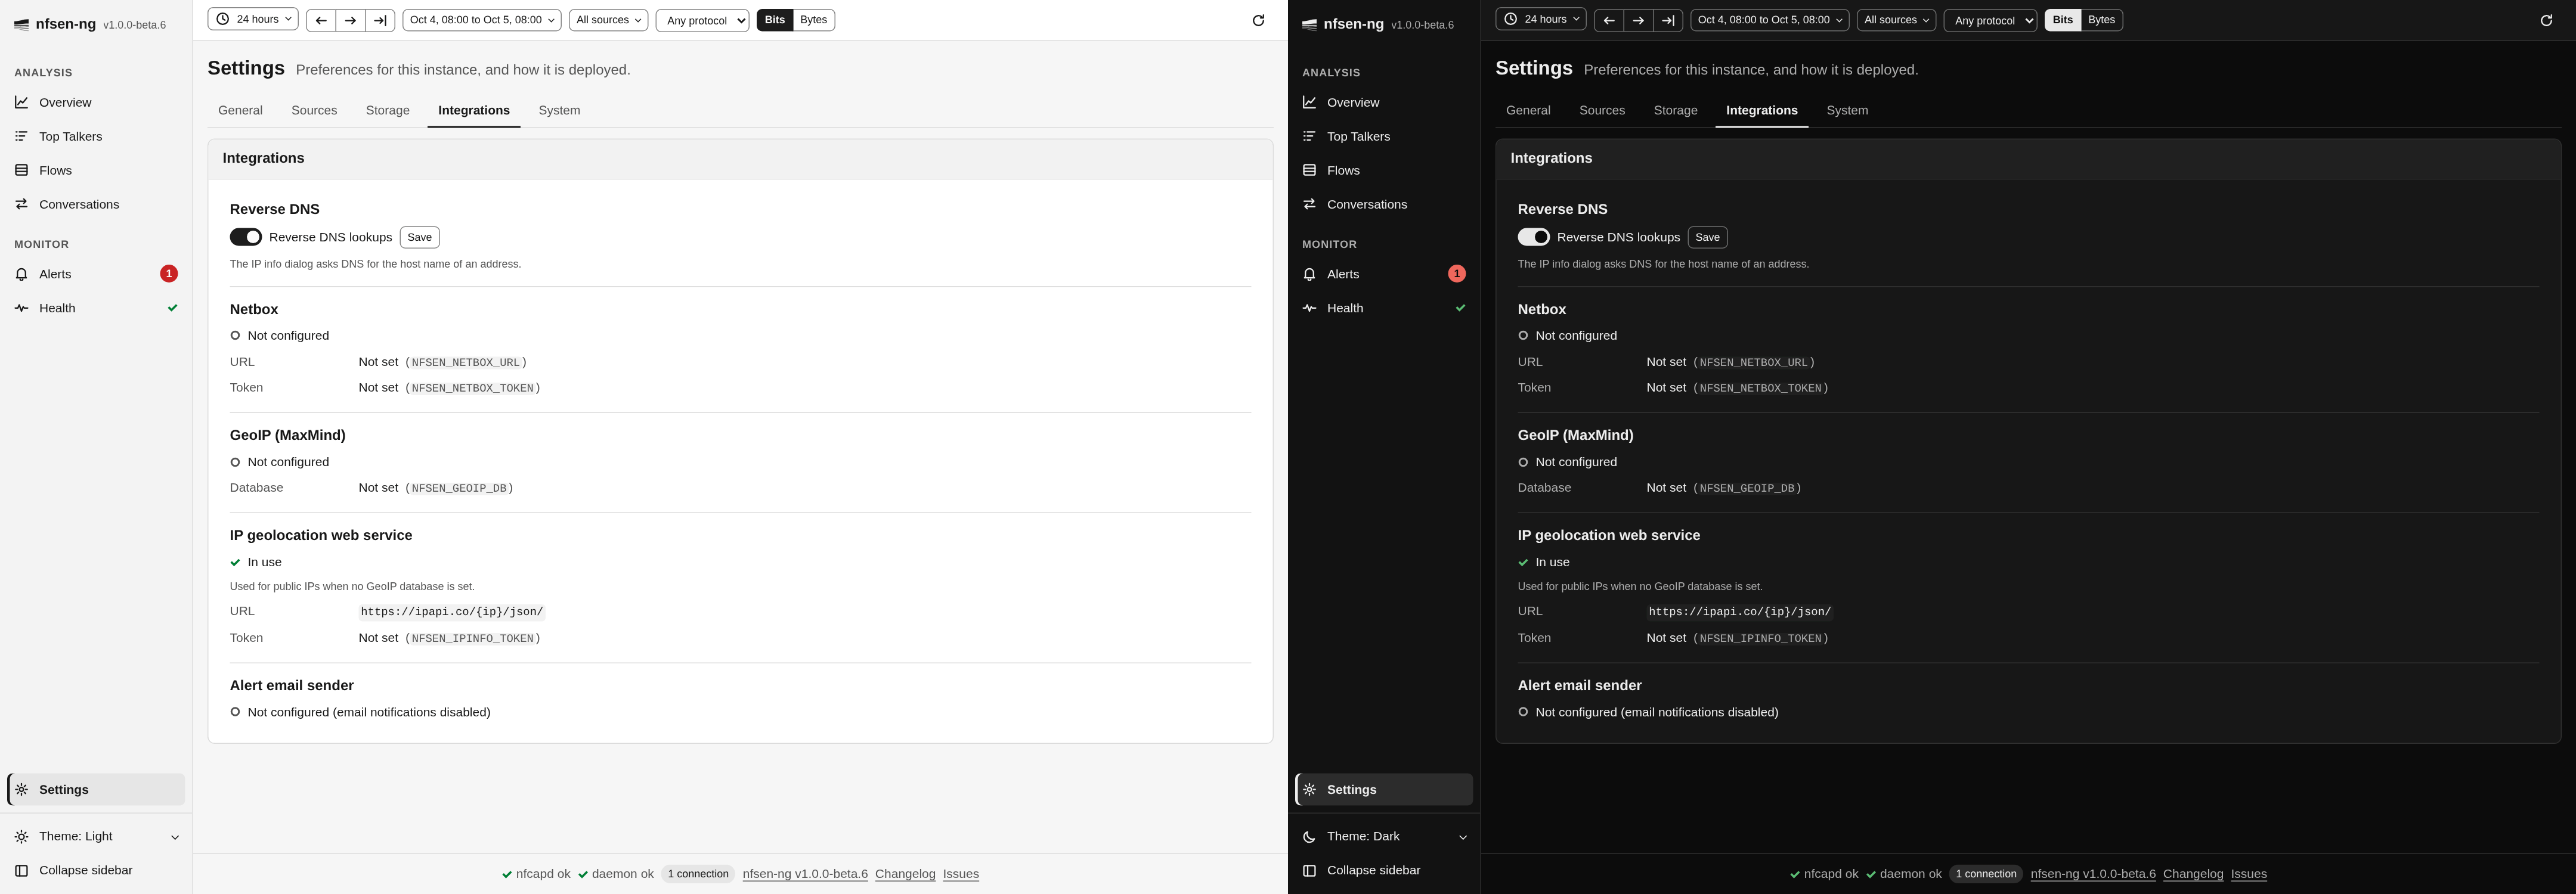
- Reverse DNS: whether the IP info dialog asks DNS for the host name of an address. This is the one switch on these tabs; Save next to it stores it.
- Netbox: whether a Netbox instance is configured for private addresses, with its URL and the token masked.
- GeoIP (MaxMind): the local geolocation database, if one is set, with its type and build date and whether IP lookups use it, or the reason they can’t.
- IP geolocation web service: the service used for public addresses when no GeoIP database answers, with its URL and the token masked.
- Alert email sender: the From address alert emails use, or Not configured, which means email notifications are off.
System
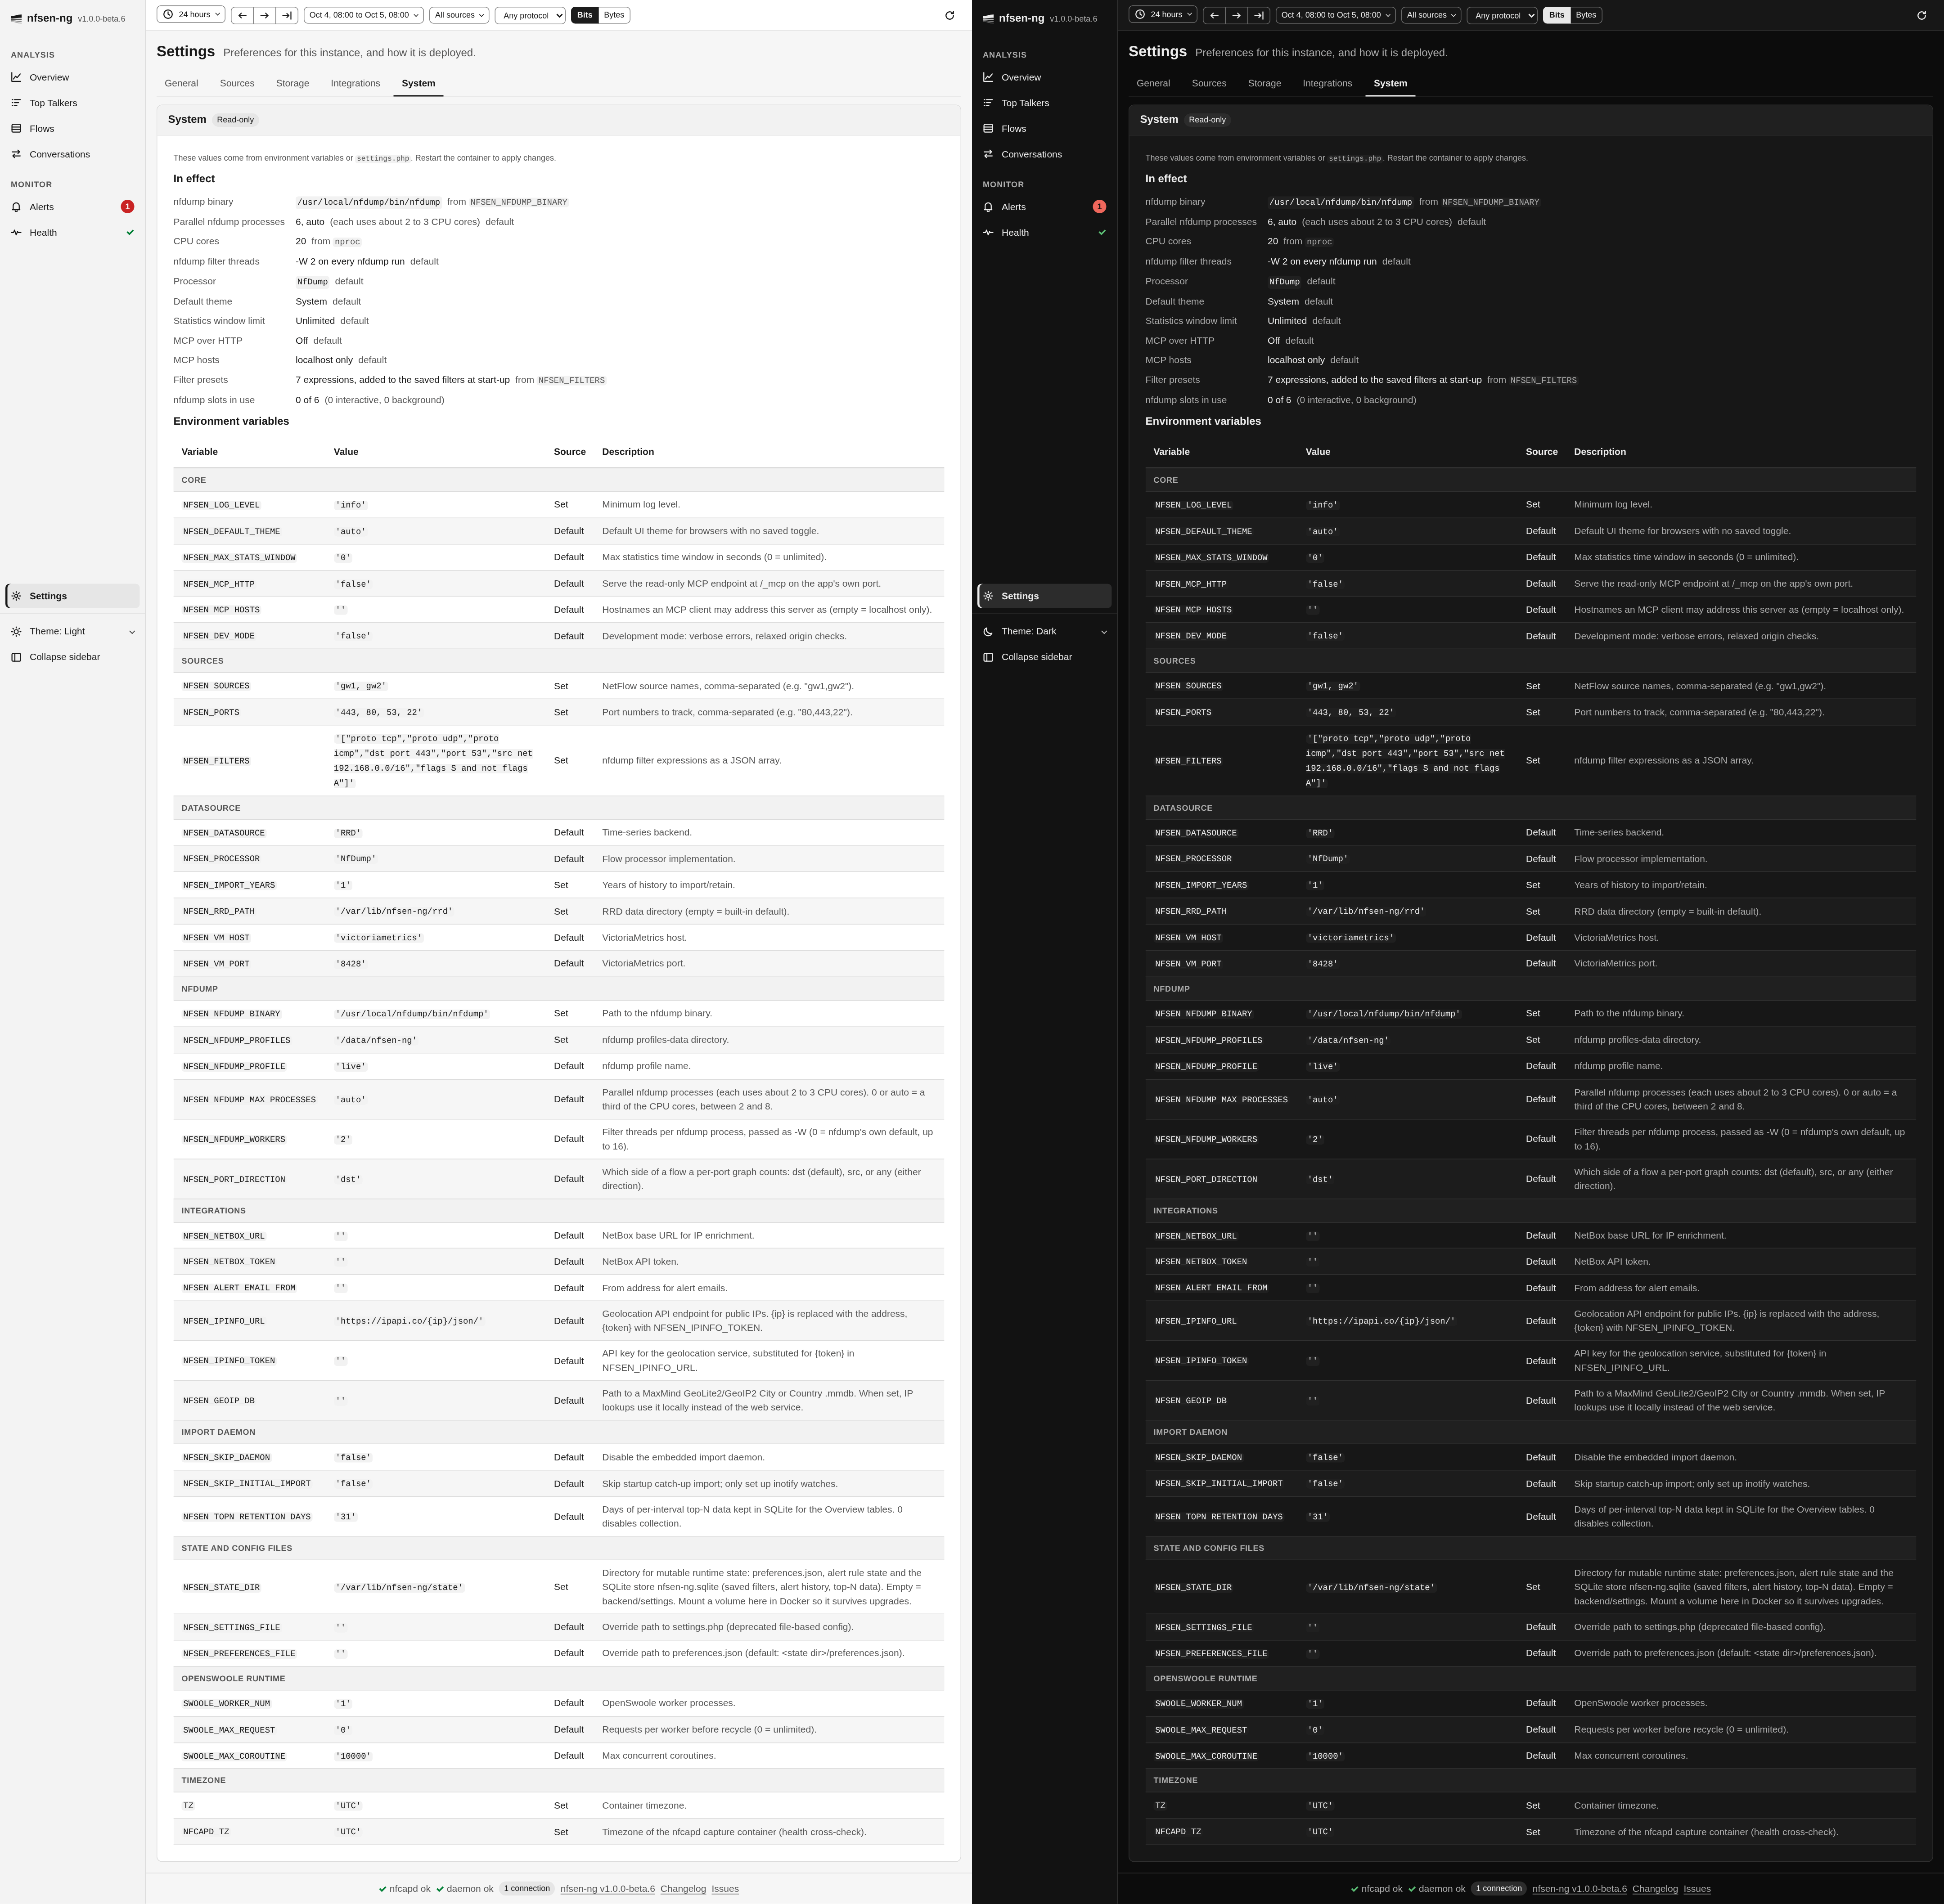
System shows what the instance runs with. In effect lists the values the
app uses, each marked as a default or with where it came from, among them how
many nfdump processes may run at once (Parallel nfdump processes, auto
when derived from the CPU cores), the nfdump filter threads each one
starts, and the nfdump slots in use right now. Environment
variables lists every variable nfsen-ng reads, grouped, with its value, whether
it was set or defaulted, and what it does; tokens are masked. If a settings.php
is loaded, the tab says so, because its values win over the variables.
You (or whoever you ask for help) can see this way exactly what an instance is configured with, without shell access to the host.
Looking Up an IP
Every IP address shown as a link opens a dialog with context on that address, without leaving the page: in the key figures and the top list on Overview, in the tables of Top Talkers and Flows, and on Conversations, where you can also click an address in the Sankey. The dialog stays open while the page updates underneath it.
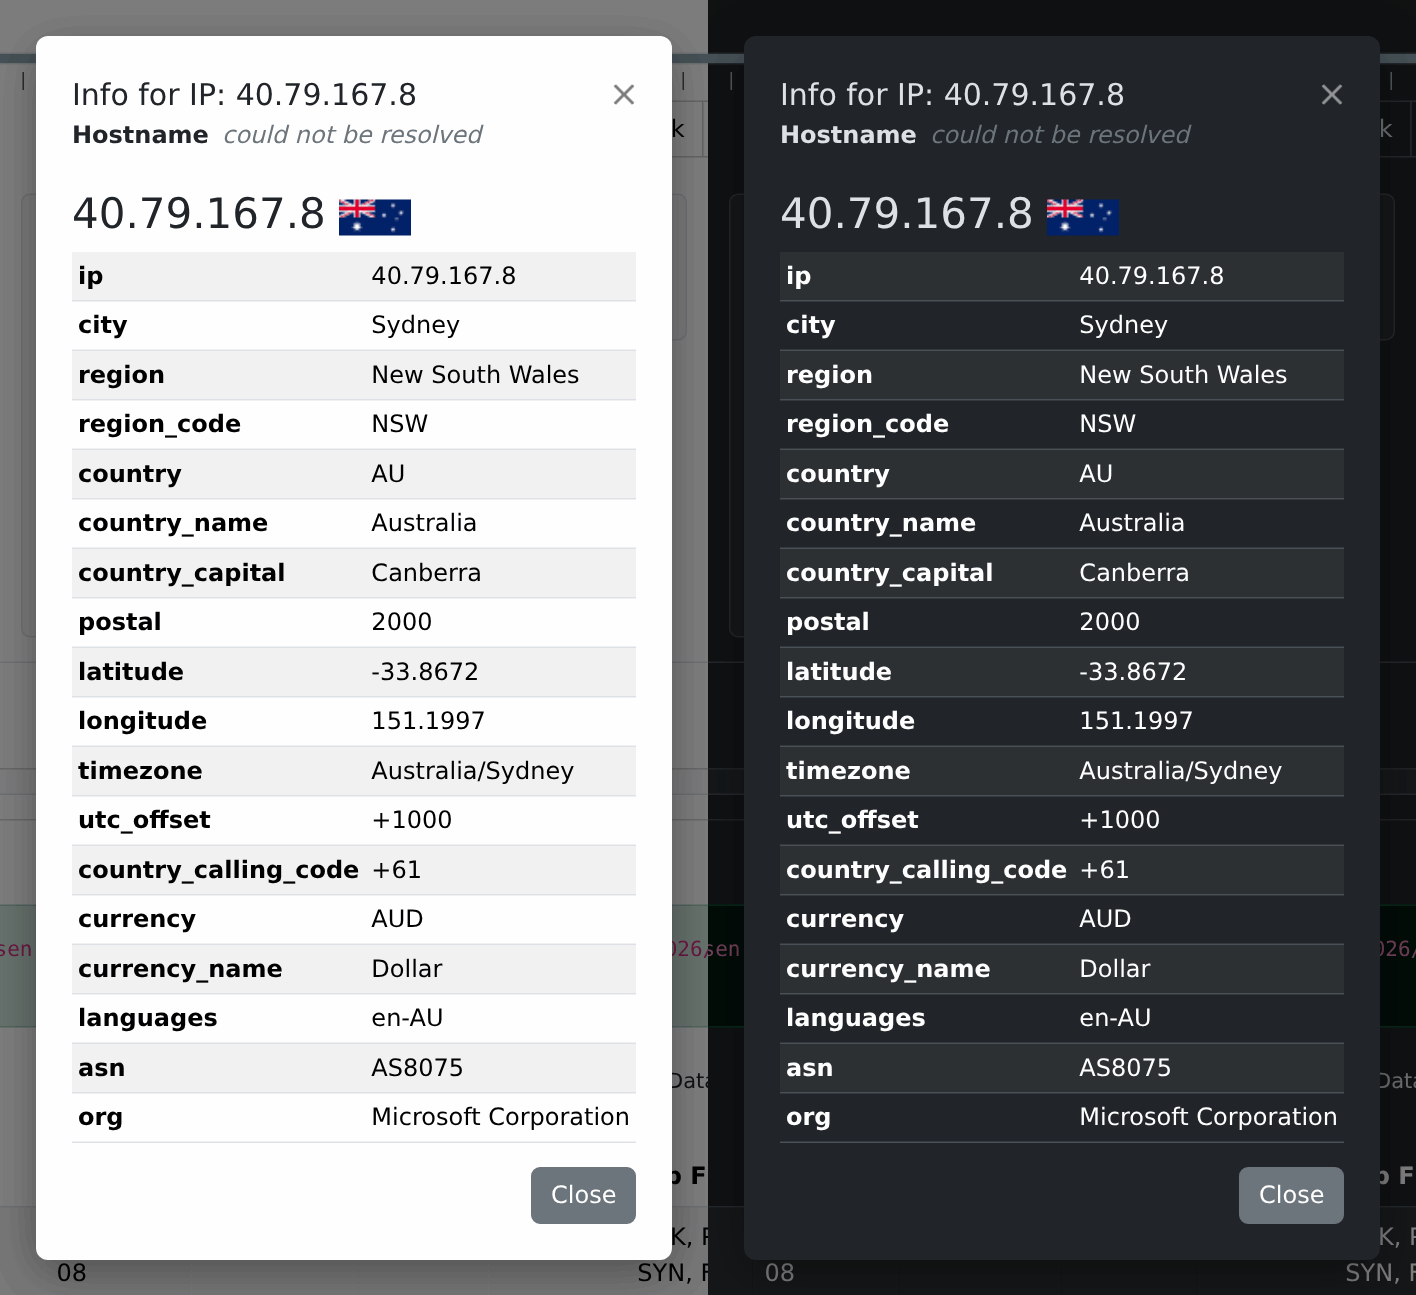
What you get
- Hostname: reverse DNS, if the address resolves to a name. An administrator can turn these lookups off in Settings; the dialog then says the name was not looked up.
- For a public address: its Location (city, region, country with its flag, coordinates, and whatever else the source knows, such as the network owner). Useful for a quick “is this a cloud provider, a CDN, or somewhere unexpected?” check on an unfamiliar destination. The last line names the source.
- For a private address (RFC 1918, e.g.
192.168.x.x,10.x.x.x), geolocation doesn’t apply, so instead you get whatever your organisation’s NetBox IPAM has on record for it, if your administrator connected one: description, tenant, VRF, role, status (see Configuration).
The two answer different questions (who owns this address out on the internet? versus which of our machines is this?) and you get exactly one, decided by the address itself. That split is also a privacy boundary: an internal address is never sent to a geolocation service, so your addressing scheme stays on your network.
Where the location comes from
If your administrator installed a local MaxMind database
(NFSEN_GEOIP_DB), the
location comes from it: nothing leaves the server, there is no rate limit, and the
dialog says Source: MaxMind database.
Otherwise the lookup calls a web service over the internet, ipapi.co unless your administrator pointed it somewhere else, and the dialog names that service. It only fires for public addresses, and only when you click one, not automatically for every row in a table. If your nfsen-ng instance has no outbound internet access, that part of the dialog comes back empty; reverse DNS and Netbox lookups (if configured) are unaffected.
If the location part shows a warning instead
Web services cap how many lookups they answer for free, and the default one is
fairly strict about it. Once you’re over the cap the dialog says so
(RateLimited, or whatever the service calls it) in place of the usual table.
Reverse DNS still works.
It clears on its own once the service’s counter resets, which may be the next minute or the next day, depending on which cap you ran into. If you’re hitting it regularly, ask your administrator to set up a local GeoIP database, switch services, or add an API key (Configuration covers all three, and lists several free alternative services).
Overview
nfsen-ng has three moving layers, all inside a single long-running PHP process:
nfcapd (external)              → writes rotated capture files to disk
      │  inotify
      ▼
ImportDaemon (backend/common)  → reads each new file with nfdump, writes the
      │                           datasource, queues the file for the top-N
      │                           collector, evaluates alert rules per interval
      ▼
Datasource (Rrd|VictoriaMetrics)   time series: flows, packets, bytes per 5 min
SQLite store (backend/store)       top-N lists, saved filters, alert history,
      │                            query timings
      ▼
Shell + pages + actions + SSE (php-via / Datastar) → browser
Stack
| Layer | Technology |
|---|---|
| Runtime | PHP 8.4 on OpenSwoole coroutines |
| Web framework | php-via: signals, actions, SSE, in-house |
| Reactivity | Datastar 1.0.4: server-driven DOM patching over SSE, and its Rocket components for the charts, the table, the filter editor and the toasts |
| Templates | Twig, one template per page plus the shell parts |
| Flow decoding | nfdump 1.7.10 CLI, invoked as a subprocess, several at once |
| Time series | RRD (default) or VictoriaMetrics, pluggable per the Datasource interface |
| Everything else | SQLite through pdo_sqlite, one file in the state directory |
| Charts | Apache ECharts (traffic graph, Sankey, Matrix) |
| Components | sb-relative-time and sb-popover from Starbase, vendored |
One long-running process
backend/app.php is started once and stays running: OpenSwoole’s HTTP server,
the SSE broadcaster, the import daemon’s inotify watch, the top-N collector’s
queue and the SQLite connection all live in the same process’s memory for as long
as it’s up. That makes the reactive loop cheap (signals and their subscribers are
plain PHP objects, and each browser tab’s page state is an object in memory, not
something serialised to a session store between requests), but the process holds
real state: per-tab results, alert cooldowns, file-watch handles, caches. A
deploy is a process restart, not just a new request. When php-via revives a
tab’s context (it re-runs the page handler under the same context id), Revival
hands the tab its results back; a reload gets a new context and starts clean.
Signals only the server sets start from scratch on a revival, so a query that
was running when the tab went to the background does not leave it waiting
forever.
One process also means one memory budget for every tab. The Docker images run
PHP with memory_limit 512M, and deploy/systemd/nfsen-ng.service passes
-d memory_limit=512M: a worker that runs out ends every session at once and
starts a catch-up import when it comes back. Large results therefore stay bounded
where they are read. nfdump aggregates before the worker parses anything (-s
with -n, -c for a listing, -s proto for an alert’s traffic filter), a Flows
listing above 1,000 rows first checks that it fits, and the import sends at most
one progress render every 250 ms. The System card on the Health page shows the
event-loop lag, how late a 100 ms timer fires in this process.
A stop (docker stop, systemctl stop, Ctrl-C) runs AppStartup::shutdown()
from php-via’s onShutdown: the import daemon, the top-N collector and the
alert checks end, the nfdump runs of the tabs’ queries and of MCP calls and the
capture file walks stop, an import finishes the capture file it is on, and the
process exits within about a second rather than being killed after
max_wait_time.
In development, deploy/docker-compose.dev.yml runs this same process under
entr, which stops and restarts it whenever a watched .php/.twig/.js/
.css file changes. There’s no build step, but also no hot-module reload: a
restart means every open browser tab’s Datastar session reconnects the SSE stream
and gets a resynced page.
See Reactive Loop for how pages, signals, actions and SSE fit together, Data Sources for the storage backends, Import Pipeline for how nfcapd files become stored data, and SQLite Store for the non-time-series data.
Reactive Loop: Pages, Signals, Actions & SSE
There is no REST API and no client-side state store. Every piece of UI state the server needs is a signal; every user interaction that needs server logic is an action; every update reaches the browser as an SSE-pushed DOM patch. This is the Datastar model, implemented server-side by php-via.
One route, seven pages
There is exactly one server route, /. The pages (Overview, Top Talkers, Flows,
Conversations, Alerts, Health, Settings) are addressed by the URL hash:
#/overview, #/talkers, #/flows, #/conversations, #/alerts, #/health,
#/settings. nfsen-router.js keeps the hash and the tab signal page
in step:
- A click on a sidebar link changes the hash. The router sets
$pageat once, so the page sections swap on the client (inside a view transition) without waiting for the server. - It then posts one
navigateaction. The server validates the page and renders it in full;navigateresets an unknown page to the default page. - The old hashes of the tab layout (
#/graphs,#/statistics,#/sankey,#/investigate) are rewritten to their pages, and a view persisted by the old layout is mapped once by a script in<head>.
The server renders only the active page (PageRegistry::LAZY). The other
page sections hold a skeleton, and each page template reads pages.<id> only
while pages.<id>.active is true. A page switch therefore costs one render of
one page, and a live tick on Overview does not render the Flows table.
Composition
backend/app.php builds every tab from four kinds of parts, all registered in
PageRegistry:
| Part | Classes | Owns |
|---|---|---|
| Shell | Shell | The layout, sidebar, footer, notices, modal root, and the render |
| Shell modules | RangeControls, TrafficGraph, QueryKit, FilterDrawer | The controls bar, the traffic graph, filter validation and estimates, the filter drawer; each has a top-level Twig key (range, graph, querykit, drawer) |
| Pages | OverviewPage, TalkersPage, FlowsPage, ConversationsPage, AlertsPage, HealthPage, SettingsPage | Their signals, actions and pages.<id> view data |
| Page states | PageStates with ShellState, OverviewState, TalkersState, FlowsState, ConversationsState | Per-tab results, notices and caches, in memory |
Each page implements Page (backend/pages/Page.php): id(), title(),
lede(), icon(), group() (analysis, monitor or system), signals(),
register() and viewData(). For every new context, app.php calls
signals() on the shell, the modules and the pages, then register(), then
renders through Shell::render().
Signals
$c->signal('ip', 'conv_group', clientWritable: true);
A signal has a default value, a name, and a scope:
- TAB scope (the default) is private to one browser tab (one context).
- Shared scopes (
ROUTE,SESSION,GLOBAL, or a custom string likerrd:live) are one instance shared by every context in the scope. clientWritable: truelets the browser’s POST, and a revival, update the signal.clientWritable: falsemakes it server-owned: php-via ignores the posted copy and sends the server’s value back, so a stale copy in the browser never overwrites it (query_running, the query progress, the stored graph’s figures). A signal the server sets but whose copy in the browser carries it across a revival stays client-writable:range_live,range_preset,flows_graph_key. Every declaration says which it is.
php-via puts the values of the first sync into the page itself, as a
data-signals__ifmissing meta at the top of <head>, so expressions work
before the SSE stream connects. Templates seed only the client-local _
signals they introduce.
The global signals every page reads are declared by RangeControls and the
shell: page, datestart, dateend, range_preset, range_live,
graph_sources (the global sources), protocol and graph_trafficUnit (the
global unit). Page signals keep their prefixes: graph_* and ov_* (Overview),
stats_* (Top Talkers), flows_* (Flows), conv_* and sankey_*
(Conversations), alert_form_* (Alerts), settings_* (Settings), drawer_*
(the filter drawer).
A leading _ means Datastar never posts the signal back. Most of these are
client-local: the browser seeds them itself with data-signals in the
markup, and templates use them by their bare name. They hold state only the
browser needs: $_flows_tab, $_conv_view and
$_settings_tab (which tab of a page is open), $_prevRange (for Previous
range), $_graph_logscale, $_graph_stacked, $_graph_stepplot,
$_sidebarCollapsed, $_themeChoice. Some are persisted per browser in
localStorage under nfsen-persist:<name>; _sidebarCollapsed is written only
by the collapse toggle. Server-owned signals with a leading underscore
(_flt_<target>, _est_<target>, _conv_stale, _drawer_notice, _stats_rows) are declared with
$c->signal(), pushed by the server and never posted back. Their wire id carries the per-context
hash like every server signal, so templates address them as ${{ _conv_stale.id() }}; a bare
$_conv_stale matches nothing.
Actions
$c->action(static function (Context $c) use ($conversations): void {
    self::run($c, $conversations);
}, 'conversations-run');
Actions are closures registered with a name, in the page’s register() or in an
*Actions class it calls. The client calls them with
@post('{{ conversationsRun.url() }}') in a data-on:click attribute, which
POSTs the current signals as JSON. All actions are TAB scoped; the URL is
<basePath>_action/<name> in every tab, and the via_ctx signal in the body
names the context. Templates always use {{ action.url() }} (Twig name = the
camelCase of the action name), which adds the base path. The handler reads the
signals it needs, does its work (often in a coroutine, often shelling out to
nfdump; see Nfdump Integration), and calls
$c->sync() to re-render and push the patch, or $c->syncSignals() to push
signals only (query progress, filter validation, estimates).
Every action closure catches \Throwable and reports the failure through the
page’s notices or the _error signal. php-via catches what escapes, logs it and
answers 500, and the worker keeps running, but the tab would show nothing. A
coroutine an action starts itself (Coroutine::create()) has no such guard: an
uncaught throw there still ends the worker, so its body catches \Throwable
too. The full list is in the Actions Reference.
Sync and broadcast
$c->sync()updates the calling context only.$app->broadcast($scope)re-renders every context subscribed to a scope:rrd:liveafter each imported file,admin:importon import progress,settings:savedafter a settings save,alerts:firedwhen rules fire.- The import’s broadcasts go through
ImportDaemon::broadcast(), which renders a scope at most once every 250 ms after the previous render and always sends the state at the end of that window. The start, a cancel and the end of a pass go out at once. One render of every tab per imported file runs the worker out of memory on a large import with several tabs open.
php-via 0.13 drops element patches for a tab with more than 1 MB still unsent
instead of parking the tab’s SSE write, and app.php keeps that threshold
(withSseMaxQueuedBytes()). With dropping off, an import’s stream of broadcasts
parked a slow tab’s write: php-via then lost patches from the full queue anyway,
and a stop waited for the parked write. What a drop costs depends on the patch:
- A render carries the whole page, so the tab’s next render (an action, a live tick, a broadcast) replaces a dropped one.
- A chunk of raw output or of an export is appended, so no render replaces it. If a chunk has not arrived 8 seconds after the page asked for it, the page asks again, three requests in all, and then says which output is missing or that the export failed; running the query or the export again fetches it.
- A window of the Flows list patches the list by its id. A dropped one leaves the list’s placeholder rows in view until a scroll asks for another window.
- A dialog opened in that state may stay closed: its markup comes with the next render, but the script that opens it has already run.
Signals such as query_running and scripts are never dropped.
Render cost and caches
One render is the shell, the modules, and the active page. Anything that is expensive at render time is cached process-wide, so a broadcast to many tabs does not multiply the work:
| Data | Cache |
|---|---|
| Footer capture status | Shell, 30 s |
| Health checks and metrics | HealthPage, 30 s while Health is open, 5 min otherwise, refreshed in a coroutine, never in a render |
| Settings read-only tabs | SettingsPage, 30 s, and fresh after a save |
| Top-N range results | TopNRepository, 64-entry LRU, 300 s or until the collector’s generation moves |
| Query estimates | QueryEstimator, 32-entry LRU, 300 s |
| GeoIP reader | GeoIpDatabase, until the file changes |
The graph data and the stored totals behind the KPI card are cached per tab and fetched only when due. Nothing that reads SQLite at the size of a range query, or reads a capture file, runs inside a render: actions compute results and store them in the page state, and the render reads what they stored.
The live window moves datestart and dateend every render of an analysis page,
at second granularity. Client effects that post (estimates, overview-topn)
therefore key on Math.floor(${{ datestart.id() }} / 300) and Math.floor(${{ dateend.id() }} / 300)
through window.nfsenChanged(el, ...), so they fire at most once per
five-minute interval in live mode. Result fingerprints encode a live window as
live:<width> for the same reason.
Result hosts
Large blocks (the Flows raw output, the Top Talkers table, the Conversations
payload and IP pairs table) are sent once per result. The
macro in components/result-host.html.twig renders
<div class="result-host" id="<name>-<resultId>" data-ignore-morph> with the
content only when PageState::sendResult() says the client does not have that
result yet, and empty otherwise. Datastar skips a morph when both the old and the
new element carry data-ignore-morph, and replaces an element whose id changed,
so an unchanged result is neither re-sent nor morphed, and a new result (a new
random resultId) replaces the old one. A tab that lacks part of a large result
pulls it in chunks through its own action (flows-raw). The Flows list follows
the same rule with its own element: #flowRows-<resultId>, also data-ignore-morph,
comes with its first 160 rows only when the client lacks the result and as an
empty placeholder otherwise, and the windows that flows-window sends patch it by
id. Those requests post only via_ctx (a filter on the request’s signals): the
rows, the order, the hidden columns and the zone come from the tab’s FlowsState.
Practical consequences
- No client build step. The frontend is server-rendered Twig plus hand-written
modules in
frontend/js/components/. The pieces that need real client-side behaviour (the charts, the result table, the Sankey and Matrix, the filter editor and the toasts) are Rocket elements, Datastar’s component system: typed props from attributes, asetupand acleanup. The server markup stays in their light DOM, where the page CSS and a morph reach it; a chart or table host holds only a<slot>in its shadow root. The router, the menus and the copy buttons are plain modules. The engine is the Datastar + Rocket bundle php-via serves at/datastar.js, and nothing is bundled at runtime.AGENTS.mdhas the rules for Rocket elements and the load order. - Signal names are not wire keys. A signal’s rendered id is its name plus a
per-context hash; the human name is only a server-side lookup key
(
$c->getSignal('name')). - Actions read signals, not
$_POST.$c->input()exists for plain query parameters (e.g.delete-alerttaking?id=,set-rangetaking?op=), but the normal path is signals in,$c->sync()out. - Morphs keep client state only where told. ECharts canvases sit in
data-ignore-morph data-ignorecontainers, dialogs usedata-preserve-attr="open", page sectionsdata-preserve-attr="hidden", and any attribute JavaScript sets on server markup is listed indata-preserve-attr.
Data Sources: RRD vs. VictoriaMetrics
Storage is pluggable behind one interface, Datasource
(backend/datasources/Datasource.php), selected by general.db in config
(RRD or VictoriaMetrics) via Settings::datasourceClass(). Both
implementations live in backend/datasources/.
The contract
Every datasource implements:
| Method | Used for |
|---|---|
write() | Persist one source’s per-5-minute-slot counters after import |
get_graph_data() | Time series for the traffic graph (by source, protocol or port) |
reset() | Wipe data for a rescan |
date_boundaries() / last_update() | First/last timestamps for a source |
get_data_path() | Where this source’s data physically lives |
healthChecks() | Storage-specific entries on the Health page |
fetchLatestSlot() / fetchRollingAverage() | Aggregate metrics for alert evaluation and the MCP current_load |
fetchLatestSlot() sums each source’s newest stored interval and leaves out a
source more than one interval behind the newest, so a source that stopped
reporting does not pull the value down. fetchRollingAverage($sources, $profile, $window, $end) averages the window that ends where the interval starting at
$end begins; without $end, the window before the newest complete interval by
the clock. Both answer in one unit: per second on RRD, per 5 minutes on
VictoriaMetrics. They are what AlertManager reads for a rule without a traffic
filter. A rule with a filter runs nfdump instead, and its percent-of-average
baseline is the average of its own recorded values, kept in the SQLite store
(see Alerts).
Both datasources also implement TotalsProvider
(backend/datasources/TotalsProvider.php): fetchTotals() returns the stored
flows, packets and bytes of [start, end) summed over sources for one protocol
(any, tcp, udp, icmp, other), and fetchProtocolTotals() all five in one
pass. The window covers the capture files whose start lies inside it, the same
set an nfdump -R over that window reads. The Overview Total traffic card and
the Flows Range totals read them, so neither needs a capture file. Callers check
Config::$db instanceof TotalsProvider and show Not available otherwise.
RRD (default)
One .rrd file per source (Rrd::get_data_path()), nested under a profile
subdirectory: {data_path}/{profile}/{source}[_{port}].rrd. A companion
.rrd.first sidecar file tracks the true first-write timestamp, since
rrd_first() isn’t reliable for that. RRD trades flexibility for
simplicity: it’s a single PHP extension (ext-rrd), no separate service to
run, and it’s what classic NfSen used. For totals over long windows, Rrd caches
whole-day sums per file (keyed by the file’s inode), so a 30-day or one-year
total is not a long rrd_fetch on every render.
VictoriaMetrics
Writes Prometheus-exposition-format samples over HTTP to a VictoriaMetrics
instance (deploy/docker-compose.victoriametrics.yml), queried back via its
PromQL-compatible HTTP API (query_range, tfirst_over_time,
tlast_over_time). This trades the extra moving part for a real
time-series database: longer retention, PromQL for ad-hoc queries, and no
per-source file to manage. VictoriaMetricsWatcher polls VM’s own health/
readiness so the Health page can report connectivity, not just config sanity.
Profiles
Both datasources are profile-aware: Config::detectProfiles() scans
nfdump.profiles-data for source subdirectories (or nested groups of them)
and returns the list. With exactly one profile, paths/health-check ids stay
flat (rrd_data_gw); with more than one, everything gets profile-suffixed
(rrd_data_live_gw) so the two don’t collide. This is how “live” vs. “test”
(or any nfdump profile split) shows up throughout the UI and health checks
without special-casing.
What is not a datasource
The datasources hold time series only. The per-interval top-N lists, the saved filters, the alert history and the recorded query timings live in the SQLite store in the state directory, the same for either datasource; see SQLite Store.
Import Pipeline
nfsen-ng never talks to nfcapd directly. It only reads the rotated
nfcapd.YYYYMMDDHHMM files nfcapd writes to
{profiles-data}/{profile}/{source}/YYYY/MM/DD/. Everything from there is
backend/common/ImportDaemon.php and backend/common/Import.php, wired up once
at boot in AppStartup.php.
Two passes
- Catch-up import, run once per profile at process start
(
ImportDaemon: running initial import (last N years)). It scansnfdump.importYears()worth of history and writes anything not already reflected in the datasource, so a freshly (re)started server shows its history instead of an empty graph. A profile with no data yet is skipped until its first manual Trigger. - Ongoing inotify watch, registered per source directory
(
inotify_add_watch(..., IN_CREATE | IN_MOVED_TO)) and polled every second by an OpenSwoolesetIntervaltimer thatAppStartup::boot()sets up (ImportDaemon::pollOnce()). nfcapd rotates a fresh file every five minutes by default; each new file:- is summarised with
nfdump -I(flows, packets and bytes, per protocol) and written into the active datasource, and withNFSEN_PORTSalso queried once per port (see Per-port series), - is recorded in
ImportStats(for the rate on the Health page), - is queued for the top-N collector, which gets the
-Itotals along so it does not run-Iagain, - triggers
$app->broadcast('rrd:live'), so every open tab redraws its graph without a reload, - is reported to
AlertManager::onFileImported(), which evaluates the rules once per interval (see Alert evaluation).
- is summarised with
OpenSwoole coroutines cooperate, so a blocking inotify_read() inside a
long-running coroutine would stall the whole worker. The watch is polled on a
one-second timer instead; inotify_read with no events pending returns
immediately.
Manual controls
The Import card on the Health page exposes Trigger (trigger-import),
Backfill (backfill-import, VictoriaMetrics) and Rescan (force-rescan,
RRD). All three lock the profile’s ImportDaemon (isLocked()) for their
duration, so the ongoing inotify poll doesn’t race a manual pass and advance the
datasource’s last-update watermark ahead of where the manual pass has reached.
A normal pass skips every file at or before that watermark. Backfill does not:
it offers every capture file to the datasource, which writes each sample at the
timestamp it belongs to, so an archive older than the install is filled in.
Rescan resets the profile’s datasource first and then imports everything.
Progress is broadcast on admin:import, and cancel-import stops a pass. The
progress broadcasts, and the rrd:live broadcasts of the catch-up, go out at most
once every 250 ms with the latest state (ImportDaemon::broadcast()); the start,
a cancel and the end of a pass go out at once. The warnings and errors of a pass
keep their newest 100 entries in the Import log, and the rest are counted.
Per-port series
With NFSEN_PORTS set, each capture file is queried once per configured port and
the result written to that port’s own database. NFSEN_PORT_DIRECTION decides
which side of a flow counts:
| Value | Query | Counts |
|---|---|---|
dst (default) | -s dstport:p 'dst port N' | Flows whose destination is the port |
src | -s srcport:p 'src port N' | Flows whose source is the port |
any | -s port:p 'port N' | The port in either direction |
The default is what every release so far counted, and it stays the default: widening it would step every existing port series upward against data already on disk under the old meaning.
Set any if your port graphs are empty while the per-source graphs work. That
is what an exporter reporting one direction of each flow looks like, which
ingress-only or egress-only sampling produces: every flow names the port as its
source, so a destination-only query matches nothing
(#173). A port’s traffic is
arguably the conversation on it, so any is the truer reading, but it is opt-in
because the numbers it produces are not comparable with the ones already stored.
Under any, each port counts only its own rows: -s port:p reports both ports of
every matching flow, so a request from 10007 to 443 yields a row for each, and
summing them all would roughly double every value.
A configured port that sees no traffic in a run is named once in the import log, so a flat graph says why instead of leaving you to guess whether collection is broken.
Top-N collection
TopNCollector (backend/common/TopNCollector.php) fills the per-interval top-N
lists behind the Overview page. Every path that imports a capture file (the
inotify watch, the catch-up, Trigger, Backfill, Rescan) calls
TopNCollector::enqueue() with the file and its -I totals.
- Skip rule. One primary-key lookup in
topn_intervaldecides whether a file is needed: an interval collected (ok or empty) from a file at least as new as this one is skipped, and so is a file that failed three times without changing. So a Backfill or Rescan does not collect the same intervals again unless the capture file changed. - Worker. A worker coroutine lives while the queue (up to 4096 files) has
items. It starts up to half the nfdump process limit of collecting coroutines
(
NfdumpSlots::backgroundMax()), each taking the oldest queued file. For each file a coroutine runs nfdump twice (-o csv, eight-sstatistics and then the ninth, since nfdump takes at most eight per run) and parses the multi-statistic csv withMultiStatCsvParser. It hands the rows to the worker, which is the only coroutine that writes. With fewer than 4 processes that is one file at a time; with 8 processes on a 20-core host, files of 300,000 flows took 85 to 110 ms each instead of 250 to 300 ms. - Writes. Each interval is stored in one small transaction together with a pending mark. Every 48 stored intervals the worker adds the marked intervals to the hour and day sums, one bucket per transaction, and checkpoints the WAL every second write. After ten minutes without a store, the minute tick flushes what is left, and gives way between two transactions once the worker runs again. Range reads include the marked five-minute rows, so every answer stays exact while sums are pending.
- Slot rule. The collector runs as background work (see
Nfdump Integration): it holds at
most half the slots, starts a run only while a slot stays free for a user
query, and never while a user query waits. It also waits while a bulk import
holds a daemon lock. Its runs use the query handle
topn, so a user’s Kill never reaches them. - Gap filler. One minute after start and then every ten minutes while the
queue is empty, it walks the retention window day by day, newest first, and
queues up to 500 capture files that have no usable interval. During a
backfill, the next pass starts once the queue is down to 250 files, until
nothing is missing or a file fails. Files being collected count as collected,
so a pass never queues them twice. Collect missing top-N now on the Health
page (
topn-fill) runs the same pass at once. - Pruner. Five minutes after start and then hourly, it deletes what fell out
of
NFSEN_TOPN_RETENTION_DAYS, in small per-statistic chunks with pauses in between. - Generation. Each profile has a generation counter that moves every 50 written files during a backlog and when the queue drains. Cached range answers of the Overview page are dropped when it moves.
With retention 0, or when the SQLite store is unavailable, the collector stays
off and the Health page says why.
Alert evaluation
AlertManager::onFileImported() receives each imported file with its interval.
It evaluates every enabled rule of the profile once per interval, when every
configured source has reported that interval or a newer one, in any arrival
order. A source with nothing waiting on disk once a later interval is in counts
as down and is left out until it reports again. Rules without a traffic filter
read each source’s stored value right after its import; rules with a filter run
one nfdump -s proto -n 0 -o csv over the interval’s files and add up the
protocol rows, so nfdump sums the traffic and the worker reads a few lines. The
evaluation runs as background work and waits at most 60 seconds in total for the
processes of all its filtered rules; a rule still without one is left out of
that interval with no free nfdump process in the log. {time} in a
notification is the start of the interval. See Alerts.
Environment caveat
Cross-container inotify (nfcapd writing into a bind-mounted directory that a
different container watches) doesn’t reliably propagate on every host, notably
WSL2. If the ongoing-watch path never seems to fire in a dev environment, check
that first, not the daemon code.
Nfdump Integration
backend/processor/Nfdump.php is the one place that runs queries through the
real nfdump binary. Top Talkers, Flows, Conversations, the filtered graphs, the
Overview exact run, the top-N collector and the alert traffic filters all go
through it. Only filter validation (FilterValidator) runs nfdump on its own, for
a parse-only check.
Composing the filter
A page never hands its filter text to nfdump as is. FilterComposer
(backend/query/FilterComposer.php) joins the parts with and, each in its own
parentheses: the global protocol as a term from ProtocolFilter (proto tcp,
proto udp, (proto icmp or proto icmp6), or the complement for other), the
byte limits as bytes > n and bytes < n, an ipv4 term where the query needs
one, and the user’s filter. So an or in the user’s filter cannot escape the
byte limits or the protocol. It counts parentheses the way nfdump 1.7.8 tokenises
them (outside one-line quoted strings and # comments) and rejects an unbalanced
filter with Unbalanced parentheses in the filter. before anything runs; a
closing parenthesis could otherwise close the wrapper and drop the rest.
Command construction
{binary} {flattened options} -- {escapeshellarg(filter)}
Options (-R, -M, -o json, -a, …) are set via setOption() and flattened
in registration order. Each value is shell-escaped, and an empty value gives a
bare flag. A list value repeats the flag once per item, in order: the top-N
collector sets -s to a list of eight statistics, the most nfdump takes, and gets
all of them from one run (-s 'srcip/bytes' -s 'dstip/bytes' …).
The filter, if any, is appended as a single trailing, shell-escaped, bare
argument after --, so a filter starting with a dash is never read as an
option (-w /tmp/x would otherwise write a file). It is not passed with -f:
nfdump reserves that flag for “read the filter from a file”, and a filter string
given to -f fails with a path does not exist error rather than a filter
syntax error, which is easy to misdiagnose when testing a filter by hand.
-M must be registered before -R. Unlike the other options, -R’s handler
doesn’t just store its value: it calls convert_date_to_path() immediately, which
resolves the time range to nfcapd file paths by scanning the sources -M has
recorded so far. Register -R first and that scan sees zero sources, finds no
files, and throws. This is how a filtered alert rule once could never fire
(#153).
Option values the client can influence are checked before they reach the command
line: the statistic element against StatisticCatalog, the order against
StatisticCatalog::ORDER_BY, the row limits against the offered values.
Execution
execute() runs the command via proc_open, prefixed with exec so
proc_get_status()['pid'] is nfdump’s own PID and not a wrapping shell’s
(otherwise Kill would stop the shell and leave nfdump running). It separates
stdout and stderr, and returns:
decoded: the records (JSON array or newline-delimited, csv, or the fixed-width text of a bidirectional aggregation read back into columns);rawOutput: nfdump’s stdout, untouched on every path, which the Flows Raw output tab shows andNfdumpSummary::fromTextFooter()parses;command: the exact command line, as shown to the user;stderr: what nfdump printed on its error output, without the notices it prints on every run (such as its lowered worker count); the key is missing when nothing else was printed;notes: what nfdump printed beside the data, such as a reached limit,No matching flows, a non-zero exit code or the execution time;exitCode.
Exit codes are read from proc_get_status() while the process ends, with
Nfdump::exitCodeFrom() as the fallback: under OpenSwoole’s process hook
proc_close() returns the raw wait status (exit 254 arrives as 65024) and
sometimes 0 for a failed run. A non-zero exit with no rows throws
NfdumpException (a RuntimeException) with a readable message: 254 is a
filter syntax error, 127 a missing binary, 255 an initialisation failure, 250 an
internal error. NfdumpException::wasStopped() is true for a run ended by
signal 9 or 15, which the pages report as Query cancelled. rather than as an
error. No matching flows with exit 0 is a normal empty result.
nfdump’s error text can quote the filter, markup included, so every message and
command reaches the page as plain text that Twig escapes. The exact command
is logged at LOG_DEBUG, the fastest way to see what a UI action asked nfdump
for.
Filter validation
FilterValidator (backend/processor/FilterValidator.php) runs
nfdump -Z -- <filter>, which only parses the filter (1 to 4 ms), with a
two-second timeout. Exit code 0 means valid; otherwise the message is nfdump’s
Line N: text (without Line 1: for a one-line filter). It bypasses
execute(), so a check takes no nfdump slot and never waits behind a running
query. Answers are cached per binary and filter (128 entries); a timeout is not
cached. The validate-filter action writes the answer into _flt_<target>, and
the newest request wins.
StatisticCatalog::unsupported() uses the same parse-only run to probe the NEL
statistics once per binary: nfdump -Z '' -s nevent/bytes exits 1 with
Unknown statistic on an nfdump built without them.
Processes and slots
NfdumpSlots caps how many nfdump processes run at once, at
Config::$settings->nfdumpMaxProcesses: NFSEN_NFDUMP_MAX_PROCESSES, or with
auto a third of the CPU cores this process may use, between 2 and 8
(CpuBudget). One nfdump keeps 2 to 3 cores busy (a reader thread, the main
thread that aggregates, a filter thread) and holds its own aggregation table, so
the cap bounds CPU and memory together. See
nfdump processes and CPU cores
for the settings.
execute() takes a slot before it spawns nfdump and gives it back afterwards. A
slot belongs to one of two classes, set per coroutine with NfdumpSlots::runAs():
- Interactive (the default): a user waits for it. Top Talkers, Flows, Conversations, the filtered graphs, the Overview exact run and an alert’s Test. It may take every free slot and waits up to 30 seconds for one.
- Background: the import, the top-N collector and the live alert evaluation. It holds at most half the slots, starts only while a slot stays free for a user query (with one slot: only while nothing else runs), and never while a user query waits. It waits up to 10 minutes, so a long query delays an import rather than dropping a file. The live alert evaluation limits its waits to 60 seconds in total.
A user query therefore waits only for a running nfdump to end, never in a queue
behind background work. The import, the alert checks and the collector each run
their own Nfdump instance, so a reset() of one never changes the options of
another while it waits for its slot.
Every run passes -W after the caller’s options: NFSEN_NFDUMP_WORKERS filter
threads, 2 by default, from nfdump 1.7.3 on. Without it every nfdump starts half
the host’s cores as filter threads. nfdump’s notice that it lowered the count to
the cores online is dropped from what the pages show.
NfdumpSlots also records which query owns each running process, keyed by a
query handle: the caller’s context id for a browser tab, topn for the
collector. The Kill action (kill-nfdump) stops every process of its own tab’s
handle and names their PIDs, so with several queries in flight it hits the right
ones, and never a collector run. The cap counts this worker’s own processes. An
nfdump someone starts by hand, or a second nfsen-ng on the same host, is not
counted.
Filtered graphs in parallel
A filtered graph (Apply filter on Overview, Build graph on Flows) runs
one nfdump -s proto per time bin (FilteredSeries). The build takes a pool of
interactive slots with acquireMany() and runs one bin per slot, taking slots
that free up. After each bin it gives one back to a user query that waits, and
leaves background work the room it needs: two free slots to start a run, one
while it runs. Both wait for one bin at most. Kill stops every bin in flight
and keeps the bins that finished. With 4 slots, a 7-day build over busy captures
took 14 s instead of 42 s (504 bins).
Statistics in parallel
nfdump aggregates on one thread whatever -W says, so a large statistic runs as
several nfdump processes over consecutive time slices, merged into exactly the
rows one process prints (PartitionPlanner, PartitionMerge). Top Talkers and
its side panels, Conversations and the Overview exact run use it.
- When. A read estimated at more than a second over at least 12 capture
files, split into slices of at least 6 files each, balanced by size. The
number of parts is the free interactive slots, at most 8. Once the limit is 3
or more, a split leaves one slot free for another query when 3 or more are
free, and otherwise takes up to 2. Two processes gave 1.6
times the speed of one on
-s srcip, four 1.9 times, eight 2.2 times. - Always one process. Rankings by a rate (pps, bps, bpp), Flow Records without
an
-Aaggregation (nfdump’s per-record output cannot be summed), the bi-directional aggregation, Conversations on nfdump 1.7.5, and windows within a day of a daylight saving fall-back, whose local times repeat. - First pass. Each part lists up to its share of 40,000 keys (at most 10,000, at least twice the rows asked for), which bounds the worker’s memory. A part that listed fewer keys than that is complete.
- Proof. The merged top N is exact when every top key is known in every part
(listed there, or found or ruled out by a lookup), and when no other key could
still reach the N-th total: its known total plus the cutoff (the last listed
value) of each truncated part that did not list it. Otherwise the truncated
parts run again with
-n 0and a filter naming the missing keys, and a lookup keeps only the keys it asked for. If the filter cannot name them (at most 2,000 keys, 64 KiB) or the second pass still cannot prove the top, the query runs as one process, as it does after any failure short of a Kill. - Merge. Counters add up, first seen is the earliest and last seen the
latest, and pps, bps, bpp, duration and the shares are recomputed the way
nfdump computes them.
-Arecords and pairs rank by in plus out, as nfdump’s-Odoes. - Progress and Kill. The progress line counts files read across the parts,
Kill stops every part, each part gives its slot back when it ends, and the
final status names the processes the result came from (Done in 3.1s with 4
nfdump processes.).
query_runsrecords the parts and passes of every run.
With 24 million flows and 4 processes, Top Talkers ran 1.7 to 2.3 times faster and Conversations up to 2.8 times.
When several sources are selected, -M names first a source that holds the
window’s first capture file: nfdump reads nothing at all when the first source
lacks it, as after a capture gap or for a source added later.
Getting Started
Requires Linux: OpenSwoole has no maintained FreeBSD/other-BSD port (openswoole/ext-openswoole#233).
Quick start (production-ish)
curl -O https://raw.githubusercontent.com/mbolli/nfsen-ng/master/deploy/docker-compose.yml
# edit NFSEN_SOURCES, NFSEN_NFDUMP_PROFILES, etc. in the compose file
docker compose --profile proxy up -d   # bundled Caddy, ports 80/443
# or: docker compose up -d             # app only, port 9000, behind your own proxy
Development
git clone https://github.com/mbolli/nfsen-ng
cd nfsen-ng
docker compose -f deploy/docker-compose.dev.yml up -d
docker compose -f deploy/docker-compose.dev.yml logs -f nfsen
The dev container runs the app under entr:
any .php/.twig/.js/.css change under the mounted source stops the server,
waits for its shutdown and starts it again: no manual restart, no build step.
Its entrypoint, deploy/docker-entrypoint-dev.sh, also runs from the mounted
source, so a change to it takes effect when docker compose up -d recreates the
container, without an image rebuild. The dev
state (preferences, alert rules and the SQLite store nfsen-ng.sqlite) lives in
backend/settings/, next to the code, and is ignored by git.
The compose file’s commented-out nfcapd/nfcapd-test services can inject
real (or softflowd-generated) traffic on ports 9995/9996 for local testing;
without them the app still runs, just against whatever nfcapd files already
exist under the mounted profiles-data volume.
Useful commands
composer install        # PHP deps
composer test            # Pest test suite
composer test-phpstan    # static analysis, level 8
composer fix              # auto-format PHP (php-cs-fixer)
composer before-commit   # fix + phpstan; run this before every PHP commit

pnpm install              # JS deps; copies ECharts
pnpm run lint             # Biome lint of frontend/js/components and frontend/css
pnpm run format           # Biome format --write
pnpm run test-e2e         # the browser suite against a running instance (BASE, CHROME)
php-via serves the Datastar bundle, so it is no npm dependency. ECharts, the
Starbase components under frontend/js/starbase/ and the licence files are
committed, so a checkout runs without pnpm install; see
Project Structure and AGENTS.md for updating them.
See Project Structure for where things live, Testing for the test suite in more depth, and Environment Notes for sandbox-specific gotchas that have nothing to do with the app itself but will otherwise cost you an hour.
Project Structure
backend/
  app.php                  entry point: server config, then one page('/') that asks every shell
                            module and page for its signals and actions and renders the Shell
  mcp.php                  MCP server over stdio, run as its own process (see features/mcp.md)
  pages/                   the UI composition (namespace mbolli\nfsen_ng\pages)
    Page.php, ShellModule.php   the two interfaces
    PageRegistry.php        page and module order, legacy view ids, query kind → page
    Shell.php               layout data, footer status, modal, the render itself
    OverviewPage.php, TalkersPage.php, FlowsPage.php, ConversationsPage.php,
    AlertsPage.php, HealthPage.php, SettingsPage.php        one class per page
    RangeControls.php, TrafficGraph.php, QueryKit.php, FilterDrawer.php   shell modules
    PageStates.php, Revival.php, state/   per-tab state: ShellState and one class per query page
  actions/                 action closures per area: RangeActions, GraphActions, StatsActions,
                            FlowActions, FlowGraphActions, ConversationActions, AlertActions,
                            ImportActions, SettingsActions, QueryKitActions, FilterDrawerActions,
                            ShellActions, UtilityActions, plus QueryRunner (progress, Kill, timings)
  query/                   transport-agnostic queries: TimeWindow, StatsQuery, FlowsQuery,
                            MatrixQuery, TopNQuery, TimelineQuery, LoadQuery, CoverageQuery,
                            FilterComposer, ProtocolFilter, StatisticCatalog, FilterGrammar,
                            QueryEstimator, CostEstimate, ConversationPayload, and
                            PartitionPlanner with PartitionMerge (one statistic as parallel
                            time slices, merged exactly).
                            Actions and the MCP tools both call these; neither calls the other
  store/                   the SQLite store (namespace mbolli\nfsen_ng\store): Database,
                            Migrator, migrations/, TopNRepository, SavedFilterRepository,
                            SavedFilterSeeder, AlertEventRepository, AlertSampleRepository,
                            QueryRunRepository
  common/                  Config, Settings, EnvRegistry, UserPreferences, HealthChecker,
                            HealthMetrics, AlertManager, ImportDaemon, Import, TopNCollector,
                            ImportStats, CpuBudget (cores and the nfdump process limit),
                            LoopLag (the event-loop lag probe), StarbaseAssets (the vendored
                            components to load), LogRing, Debug, GeoIpDatabase, IpLookup,
                            Table, ...
  mcp/                     optional read-only MCP server: ToolRegistry, Guard, HttpEndpoint,
                            Tool/ (one class per tool)
  datasources/             Datasource and TotalsProvider interfaces, Rrd, VictoriaMetrics
  processor/               Nfdump (the nfdump subprocess wrapper), NfdumpSlots (how many run
                            at once, in which class, and which query owns each),
                            FilterValidator (nfdump -Z), FilteredSeries, MultiStatCsvParser,
                            NfdumpSummary
  templates/
    layout.html.twig        the document: head scripts, sidebar, controls bar, graph, pages
    shell/                  sidebar, controls-bar, traffic-graph, page-header, page-skeleton,
                            footer, bottom-tabs, icons
    pages/                  one template per page (overview, talkers, flows, conversations,
                            alerts, health, settings) plus alert-test-result
    components/             filter-field, query-estimate, result-host (reused by the pages)
    drawer/                 filter-drawer
    partials/               aggregation-controls, progress-button, ip-info-modal
  settings/                env vars = deployment config; settings.php(.dist) = deprecated file
                            overlay; in dev also the state: preferences.json, alerts-state.json,
                            nfsen-ng.sqlite
frontend/
  css/
    tokens.css              design tokens: neutral surfaces and text, status and series colours
    starbase.css            Starbase's --sb-* tokens mapped onto the tokens above
    ui.css                  elements and shared components (button, card, tabs, menu, notice, ...)
    shell.css, controls-bar.css, traffic-graph.css, query-kit.css, drawer.css   shell parts
    nfsen-ng.css            pieces several pages share: chart containers, result tables, aggregation controls
    pages/                  one stylesheet per page
  js/components/            Rocket elements: nfsen-chart, nfsen-table, nfsen-sankey,
                            nfsen-matrix, nfsen-toast, nfsen-filter-editor.
                            Plain modules loaded before the bundle: nfsen-router,
                            alert-template-preview, filter-drawer, chunks (nfsen/chunks),
                            flows-list (the Flows list's exports and Columns choice).
                            Plain modules after it: datastar-persist (a Datastar plugin),
                            nfsen-controls, clipboard (nfsen/clipboard).
                            Imported only: format, download, host-state, theme-colors, tz-utils
  js/echarts.min.js         copied in by `pnpm install`'s postinstall (see package.json)
  js/starbase/              vendored Starbase components, one <slug>@<version>/ folder each,
                            starbase.lock.json and Starbase's LICENSE
                            (scripts/starbase-vendor.mjs; see AGENTS.md)
tests/
  Unit/                    Pest unit tests, one file per class roughly
  Feature/                 tests that exercise real I/O (RRD file creation, etc.)
  Arch/                    architecture rules (namespaces, dependencies)
  Helpers.php              functions Pest loads before every file (capture trees and the like)
  Support/                 FakeProcessor, fake nfdump binaries, nfcapd-written capture
                            fixtures (captures/) and the Starbase hash fixtures (starbase-walk/)
  e2e/                     browser tests driving a real headless Chrome over CDP; run.mjs runs
                            them against a live instance (BASE=, CHROME=)
deploy/
  Dockerfile, Dockerfile.dev, docker-compose*.yml, Caddyfile*, systemd/, unraid/
scripts/                   starbase-vendor.mjs (vendors and checks Starbase components),
                            seed and triage helpers
.github/workflows/
  release.yml              version bump + tag, manually triggered
  docker-publish.yml       builds/pushes the app image to GHCR (bundled Caddy uses the stock image)
  mdbook.yml               builds this book and deploys it to GitHub Pages
                            on every push to master that touches book/**
book/
  book.toml, src/          this book
  _capture.mjs             screenshot pipeline for the images in src/images (see Testing)
  _seed-captures.php       the generated traffic those images show
Adding a feature end to end
- Signals in the page’s
signals()(backend/pages/<Name>Page.php), or in the shell module that owns the concern. Global state (range, sources, protocol, unit) belongs toRangeControls. - Action in the page’s
register(), usually by calling a staticregister()of a class inbackend/actions/. It reads signals, does the work (a query runs throughQueryRunner::run()with a query kind), stores the result in the page’s state, and calls$c->sync(). Catch\Throwable. - View data in the page’s
viewData(): it returns what the template reads aspages.<id>, and runs only while the page is active. Keep it cheap: read what actions stored, never run a query or a large SQLite read. - Template in
backend/templates/pages/<id>.html.twig: bind signals with{{ bind(signal) }}, wire actions withdata-on:click="@post('{{ myAction.url() }}')". Styles go intofrontend/css/pages/<id>.css, using the tokens and the components ofui.css. - Tests: Pest in
tests/Unit/, and an e2e check intests/e2e/<page>.test.mjsfor anything a user clicks.
AGENTS.md at the repo root has the Datastar attribute syntax, the CSS rules, the
rules for Rocket elements and Starbase components, and the common pitfalls; read
it before your first template edit.
Third-party notices
The files nfsen-ng ships from other projects keep their licence next to them:
frontend/js/echarts.LICENSE and frontend/js/echarts.NOTICE (Apache ECharts,
Apache-2.0) and frontend/js/starbase/LICENSE (Starbase, MIT). pnpm install
copies the first two, scripts/starbase-vendor.mjs pull the last; the Docker
image ships them with frontend/. The Datastar bundle and its notices (Datastar
and Starbase, MIT) come with php-via, in vendor/mbolli/php-via/public/DATASTAR.md.
Testing
composer test              # everything
composer test-coverage     # with coverage

# in the app image, which has the rrd extension and pdo_sqlite:
docker run --rm --entrypoint php -v "$PWD":/app -w /app deploy-nfsen vendor/bin/pest
Run them in the app image, not on a host PHP without the rrd extension: those
tests skip silently there, and whole files return early, so a green run can mean
“nothing ran”. phpunit.xml.dist raises the memory limit to 512M, which the
architecture tests need.
Tests are Pest PHP, split into tests/Unit/ (pure logic,
one file roughly per class), tests/Feature/ (real I/O, actual RRD file creation
for example) and tests/Arch/ (namespace and dependency rules).
Patterns worth knowing
- The SQLite store in tests. Install an in-memory store with
Database::useShared(Database::open(':memory:'))and drop it withDatabase::resetShared()afterwards, so no test touches the dev store. A file store that refuses WAL, as on a FUSE mount, isDatabase::open('file:' . $path . '?vfs=unix-none'). Repositories that compare a float with an aggregate needCAST(? AS REAL), and a test for such a query should use a value where the TEXT comparison would give the wrong answer. - nfdump without nfdump.
tests/Support/FakeProcessor.phpstands in for the processor and returns queued results in order (queueRaw()for raw output).tests/Support/bin/holds small shell scripts that behave like nfdump, and they must keep their executable bit.nfdump-cannedprints$NFDUMP_STUB_STDOUTand$NFDUMP_STUB_STDERR, exits with$NFDUMP_STUB_EXITand, when$NFDUMP_STUB_ARGSnames a file, writes its arguments there, for tests that need a fixed answer or check the command line. Thenfdump-z-*scripts answerFilterValidator’snfdump -Zcheck: a valid filter, a syntax error, an unknown protocol, a host name that does not resolve, and a check that hangs until the timeout.nfdump-no-nelis an nfdump built without the NEL statistics, forStatisticCatalog. - Offline test doubles for I/O-bound classes.
VictoriaMetricsTest.phpreplaceshttpGet()/sendToVM()/tcpConnect()with in-memory stubs, so the suite runs without a real VictoriaMetrics. Its doubles are named classes, an older pattern that predates the rule below; new doubles are anonymous classes. If you add a method toVictoriaMetricsthat a double overrides, keep the signatures in lockstep: PHP fatals on a parent/child signature mismatch. - Env-var isolation. A test asserting “defaults when no env vars are set” has
to
putenv('NFSEN_SOURCES')etc. itself, and clean up what it sets;getenv()sees the real ambient environment, which in a dev container may already haveNFSEN_SOURCES/NFSEN_PORTSexported for the running app. - Profile-aware paths.
Rrd::get_data_path()/create()nest files under{data_path}/{profile}/..., not flat, andwrite()also drops a.rrd.firstsidecar next to the.rrd, which a cleanup glob for*.rrdalone won’t catch. - Pages render lazily.
Shell::render()renders only the active page, so a test that needs a page’s template data sets thepagesignal to it before rendering.PageRegistryTestpins what each page and module declares and renders. - Shared helpers. Pest loads
tests/Helpers.phpbefore every test file:makeCaptureTree()builds a throwaway nfcapd tree andremoveTree()removes it. A helper that two files need goes there, so every file also runs on its own. - Anonymous test doubles. A named class at the top of a test file gives Class not found once Pest runs more than one file, and php-cs-fixer’s PSR-4 rule renames it after the file. Test processors and datasources are anonymous classes, or come from a function that returns one.
- Coroutines hook file functions. OpenSwoole’s
Coroutine::run()turns on every hook, somkdirandfile_put_contentsyield inside it (touch,is_dir,filemtimeand PDO do not). A test that races two coroutines creates its files before it starts them.
Front-end and deployment checks
Five Pest files check things that are not PHP code:
FrontendAssetsTest: no Datastar bundle ships infrontend/js/(php-via serves it), the layout loads it only through{{ via_head() }}and{{ via_foot() }}, the ECharts licence files are there, andStarbaseAssets::modules()reads the Starbase lock (on, off, missing file, bad JSON, bad slug).StarbaseVendorTest: the offline checks ofscripts/starbase-vendor.mjs checkin PHP. Every vendored folder hashes to its version, every file to the lock, the licence is there, the lock’s Datastar banner and sha256 match the bundle, and a vendored module imports only'datastar'or files of its own folder. Two fixture folders intests/Support/starbase-walk/pin the order Starbase’s Go code hashes files in.StarbaseBridgeTest: everyvar(--sb-*)a vendored module reads is defined infrontend/css/starbase.cssor listed as a size knob, every token there maps to a token oftokens.css, and no module carries a pixel trait the tokens cannot neutralise (steps(,pixelated, uppercase labels, fixed notch clip paths).PopoverMarkupTest: every literal<sb-popover>block inbackend/templateskeeps to the popover exception of rule K1 inAGENTS.md. Its light DOM carries no Datastar attribute besidesdata-on:*,data-attr:*,data-class:*,data-style:*,data-effect,data-text,data-showand a value-formdata-bind, no$$, and no@name(in a plaindata-*value. String fixtures show that it reports each forbidden form with its line.DeployFilesTest: both Dockerfiles and the systemd unit give PHP the samememory_limit.
NfdumpVersionTest builds a capture with nfcapd, a flow and its reverse, and
checks that the installed nfdump pairs them under -B; it skips where nfdump is
older than 1.7.10 or not installed.
End-to-end tests
pnpm run test-e2e                                   # every file in tests/e2e/ against BASE
BASE=http://localhost:8080 CHROME=/usr/bin/chromium pnpm run test-e2e
node tests/e2e/flows.test.mjs                       # one file on its own
tests/e2e/ drives a real headless Chrome against a running app instance: actual
clicks, actual nfdump queries, actual SSE-pushed DOM updates. That catches bugs
the Pest suite structurally can’t: JS runtime errors, races between client-side
state and server-pushed patches, and the client/server wire contract of actions.
No Playwright/Puppeteer dependency. lib/cdp.mjs talks raw Chrome DevTools
Protocol over Node 22’s native WebSocket, using CHROME or the newest
Playwright-managed Chromium under ~/.cache/ms-playwright
(npx playwright install chromium fetches one). BASE defaults to
http://localhost:8080, the dev compose port.
| File | Covers |
|---|---|
smoke | Every page from the sidebar and the tab bar without console errors |
router | Hash routing: the default page, old bookmarks, reload and history |
controls | The controls bar: presets, custom duration, step buttons, sources, protocol, unit, profile |
graphs, graphs-ports, overview | The traffic graph, the Ports display, and the Overview KPI and top-N |
talkers, statistics, statistics-aggregation | Top Talkers: the picker, a real run, the Export popover, Flow Records aggregation |
flows, columns | Flows: run, the list, tabs, exports from the server, a new result’s list, 10,000 rows in three tabs; the Export popover and the Columns popover of the Flows list and the Top Talkers table: keys, a sync while open, a second run, an export right after the result arrives, a phone screen |
vscroll | The Flows list of 10,000 rows against the server’s own exports: windows, the last and seeded rows, stable sorts, syncs and other result tabs that leave it alone, Tab and Shift+Tab through 200 rows, the header, the Columns picker kept across a Run and a reload, CSV, JSON and Print, a new result’s list collected, themes, densities, and a context revived by a window request (tests/e2e/lib/vscroll.mjs holds the shared helpers; mutating) |
conversations | One run as Sankey, Matrix and IP pairs, and the Export popover, with the PNG item disabled in IP pairs and the nfdump command copied unchanged |
filter-validation, drawer | Live validation and estimates; the filter builder and saved filters |
alerts, health, settings | The monitor and settings pages |
mobile | The phone and tablet shell |
ui-controls | The shared controls: tabs, menus, focus, forced colours; and the popover layer on fixture popovers: keys, the .popover-list item look, choosing, one open layer, a modal over a popover, a moved host, a sync around an open one, forced colours, a phone screen, a trigger before sb-popover is defined |
no-auto-query | Nothing reads a capture file without a Run (checks the requests and the query_runs table) |
rocket | The Rocket rules on every page, with a result on Flows, Top Talkers and Conversations: one engine, no data-init on a host and no plugin attribute in its light DOM except those a popover may carry (fixture popovers check that the scan reports the rest), toasts in all four stacks, elements that keep their identity through a run and every page, labels, copying, and the DOM nodes removed hosts leave behind, popovers included |
starbase-bridge | Every colour token of starbase.css resolves to its nfsen-ng token in light and dark, every vendored Starbase component mounts without a console error, and the open sb-popover has nfsen-ng’s shadow and the menu list’s radius, padding and minimum width |
run.mjs runs every *.test.mjs file, or the files named as arguments
(node tests/e2e/run.mjs flows rocket), one after another, and exits non-zero on
any failure. A file that has not finished after E2E_FILE_TIMEOUT seconds (900)
fails, and its browsers are killed. Each file also runs on its own through an
import.meta.url check.
Switches:
E2E_SKIP_MUTATING=1skips the files that change persisted state (alerts,drawer,settingsexportMUTATING = true) and the mutating parts ofcontrols,healthandrocket(its alert Test dialog step).NFSEN_SQLITE=<path>tellsno-auto-querywhere the instance’s SQLite store is, when it is notbackend/settings/nfsen-ng.sqlite;E2E_SKIP_QUERY_RUNS=1skips that check.NFDUMP_HAS_NEL=1for an nfdump that computes the NEL statistics, whichtalkersotherwise expects to be disabled.E2E_FAST=1skips the wait for a real live tick infilter-validation.E2E_SHOTS=<dir>is whereflowswrites its forced-colours screenshots (default/tmp).STARBASE_DIR=<Starbase clone>makesstarbase-bridgealso mount 23 catalog components from the clone (drawer, popover, checkbox, checkbox-group, date-picker, virtual-scroll, data-table, input, select, tabs and the like; a vendored one comes from the clone too) and fail on a colour that is neither neutral nor an nfsen-ng status or series colour, on text below 4.5:1, and on a selected state that differs only in font weight. It reads the clone from disk.OUT=<dir>is where its screenshots go (default/tmp/starbase-bridge).
Helpers and patterns
withPage(fn, {width, height, mobile}) opens a tab and hands fn a page object
with, among others, gotoPage(id) (clicks the page’s link in the sidebar, the
tab bar or its More menu, and waits for #page-<id>[data-ready]),
setRangePreset(id), runQuery(target) (presses the
button[data-run=<target>] of a query and waits for it to finish),
signalValue(name) and signalValues(names) (read signals by name through the
hashed ids), syncNow(id) (posts refresh-graphs as page id and waits for
the morph it causes, to check what an open popover keeps across a sync),
chooseTheme(choice), withForcedColors(fn), requestLog() and
realErrors() (console errors, none of them tolerated). runQuery waits up to
30 seconds for the Run button, since it stays disabled while any query of the
tab runs, and also accepts an action that answers without a run (a cached
build). A test reaches Datastar’s store through the page’s import map,
(await import('datastar')).root.
- Only the active page is in the DOM in full. The other page sections hold a
skeleton, so wait for
#page-<id>[data-ready]before querying a page, and scope selectors to#page-<id>. - Read related signals in one evaluate.
datestart,dateend,range_liveandrange_presetchange together; separate reads can tear across a patch. - Don’t assume query results have rows. A dev instance may have gaps in its stored series, and the top-N lists fill in over time. Tests assert on the result notice or the empty state where data may be missing, and say when they skip.
- The dev app restarts on every file change, anyone’s, and php-via then
reloads every open tab. The page object notices a load it did not ask for:
the next
evaluate,waitFor,gotoPageorrunQuerythrowsAppReloadedError(THE APP RELOADED the page mid-test), and a test that fails for another reason after a reload says so in its message. Rerun the file.navigate()andreload()are expected loads; a test that causes one some other way (a link,location.reload()) callspage.expectNavigation()first, andpage.reloadCountcounts the ones nobody announced. - No browser outlives the run. Every Chromium gets a debugging pipe, so it
exits when Node does, even after a
SIGKILL; exit and signal handlers kill it otherwise, and a detached watchdog removes its profile directory. Each browser picks a free debugging port. - The mutating files clean up after themselves where the page offers a way:
alertscreates a uniquely named rule and deletes it,drawerdeletes the filters it saved. Test events of alert rules stay in the history.
Screenshots for this book
book/_capture.mjs drives the running app with the same CDP helpers and writes
every image in book/src/images/, each in the light and the dark theme stitched
side by side:
CHROME=/usr/bin/chromium BASE=http://localhost:8080 node book/_capture.mjs
It needs ImageMagick on PATH. OUT writes elsewhere (to check a run before it
touches the book), ONLY limits it to some images; the comment at the top of the
script lists the other variables. An image is replaced only when it changed by
more than antialiasing noise, so a rerun leaves an unchanged book untouched.
The images show an instance of their own, not a real network: two gateways
(NFSEN_SOURCES=gw1,gw2) fed by book/_seed-captures.php, which writes 48
hours of capture files through a real nfcapd. Office hours, an evening of
streaming and a nightly backup give the graphs their shape; outside hosts are
in the documentation ranges (192.0.2.0/24, 198.51.100.0/24, 203.0.113.0/24)
with private-use AS numbers. The alert rules and saved filters on that instance
were made in its UI, and the capture ran with FROM and TO on one day:
php book/_seed-captures.php /path/to/profiles-data # [--from=<unix>] [--to=<unix>] before the path
Static analysis
composer test-phpstan # phpstan analyse backend
The level is 8, set in phpstan.neon rather than on the command line, so an
IDE or a bare vendor/bin/phpstan analyses exactly what CI does. The app image
gives PHP the server’s memory_limit of 512M, which PHPStan can run out of;
run it with an explicit limit:
php -d memory_limit=1G vendor/bin/phpstan analyse backend -a backend/settings/settings.php --memory-limit=1G
composer before-commit runs fix (php-cs-fixer) then test-phpstan; the
convention is to run it after any PHP change, before committing. For the
frontend, pnpm run lint and pnpm run format run Biome over
frontend/js/components and frontend/css; Biome leaves the vendored
frontend/js/starbase/ alone.
One script checks the vendored JavaScript offline, including that the Starbase pin expects the Datastar bundle php-via serves:
node scripts/starbase-vendor.mjs check # frontend/js/starbase/ matches its lock
Environment Notes
Sandbox and dev-environment quirks met while working on this project. None of them are bugs in nfsen-ng itself, but each cost real time to diagnose the first time.
Driving the app without a browser
There’s no separate API to curl: every interaction is the same Datastar action protocol the browser uses:
GET /with a cookie jar to get a session + context id (via_ctxappears in the response HTML).- Every signal’s wire id is
name____<hash>, not its human name; scrape it from the response rather than guessing. POST /_action/<name>(the action name, the same in every tab) with a JSON body of{"via_ctx": "...", "<hashed signal id>": <value>, ...};via_ctxbinds the request to its context. Only the active page’s actions and signals are in the first response. A hash never reaches the server, so to reach another page, postnavigatewith thepagesignal set to its id and read the re-rendered page from the context’s SSE stream (GET /_sse).- Send an
Originheader matching the request host; curl sends none by default. Outside dev mode (NFSEN_DEV_MODE) a POST without one gets403 Forbidden: missing Origin, and one naming another host403 Forbidden: untrusted origin. - Actions that take an id (
delete-alert,test-alert, …) read it via$c->input('id'), not a signal: pass it as a query string on the POST URL.
Known flakiness
- A dev container restarts on every watched file change, and has been seen
restarting without one, which wipes every in-memory context and every tab’s
results. A previously scraped
via_ctxwill then 400 withInvalid context; re-fetchGET /. Everything persisted inbackend/settings/(preferences and alert rules inpreferences.json, saved filters, alert history and top-N data innfsen-ng.sqlite) survives. - Cross-container
inotify(a siblingnfcapdcontainer writing into a bind-mounted directory a different container watches) doesn’t reliably propagate on some hosts, notably WSL2. If the import daemon’s ongoing watch never seems to fire, check that before suspecting the daemon code; see Import Pipeline. gitinside a container whose bind-mounted repo is owned by a different uid refuses to run (“dubious ownership”). Run git from the host instead of patching the container’s global git config.
nfdump filter syntax
nfdump’s -f flag reads a filter from a file, not from an inline
string: a filter expression is a trailing, shell-escaped, bare positional
argument (nfdump [options] -- "proto icmp"). Passing a filter to -f by hand
gives a misleading path does not exist: <filter> error. See
Nfdump Integration for how the app
itself constructs the command correctly.
Overview and the Traffic Graph
The Overview page is the traffic graph plus two things read from SQLite: the KPI strip and the top-N card. The graph itself is a shell module that every analysis page shares.
The persistent traffic graph
TrafficGraph (backend/pages/TrafficGraph.php) is a shell module, rendered by
shell/traffic-graph.html.twig above the page content. There is one
<nfsen-chart id="trafficGraph"> for the whole app; it stays in the DOM when you
switch pages, so the chart does not rebuild. nfsen-chart is a Rocket element:
its shadow root holds only a <slot>, the chart container stays in the light DOM
as data-ignore-morph data-ignore, and its ECharts instance, zoom and brush live
in nfsen/host-state, so a morph that moves the element keeps them. The Flows
Traffic over time chart is a second nfsen-chart. TrafficGraph::mode() decides what
it plots:
| Mode | Page | Series |
|---|---|---|
overview | Overview | The Overview configuration: by source, protocol or port, one data type, stored or filtered |
picker | Top Talkers, Flows | Traffic by protocol: stored, stacked by protocol, summed over the selected sources, 300 points |
picker-total | Conversations | Total traffic: one neutral series, because colour there means “source node” |
none | Alerts, Health, Settings | Hidden, no data fetched, ignored by morphs |
The data comes from Datasource::get_graph_data(), RRD or VictoriaMetrics (see
Data Sources). The graph is fetched in the
render when it is due: after a range or option change, on the live tick (every
15 s on Overview, every 60 s on the other analysis pages, both only while
range_live is true and the graph shows stored data), and after an rrd:live
broadcast from the import. During an import a tab fetches at most every 10
seconds (ShellState::IMPORT_THROTTLE).
The header line comes from TrafficGraph::modeLabel(): Stored data · 5 min
resolution, Filtered data · 30 min bins, or Filtered data · press Apply
filter.
Selecting a range
The chart emits range-select when a brush drag ends, and the section posts
set-range?op=abs&from=&to=. A plain wheel scrolls the page; Ctrl + wheel zooms
the chart locally and emits graph-zoom, which the header shows as Previewing …
with Apply and Reset (or applies at once with Follow graph zoom). On a coarse
pointer the brush is armed only by Select range. Previous range restores
the client-local $_prevRange that every range change writes first. None of this
reads a capture file: every range operation ends in a render that reads stored
series.
Filtered mode
The datasources store flows, packets and bytes per five-minute slot, with no
record-level detail left, so a filter cannot be applied to them after the fact.
Filtered mode goes back to the nfcapd files: FilteredSeries
(backend/processor/FilteredSeries.php) runs one nfdump -s proto per time bin
and assembles the same series shape the datasources return.
- It runs only from the
run-filtered-graphaction (Apply filter), with query kindgraph. There is no live tick and no refresh on a filter change. The result is kept inFilteredGraphCache, so the renders that follow cost nothing. - The number of nfdump runs is bounded by the resolution, not by the width of the window. The bins run side by side, one per free nfdump process, and give a process back after each bin to a user query that waits (see Nfdump Integration). Progress is exact (bins done out of bins). Kill stops every bin in flight at once and keeps the bins that finished; the cancelled ones stay out of the series.
- The window is clamped by
NFSEN_MAX_STATS_WINDOW, and the estimate (estimate-query?target=overview) says what a build will read. - The Ports display is disabled; the filter replaces it. The global protocol becomes a parenthesised term in front of the filter on the Sources display.
The per-port graphs work the same way at import time (each capture file queried
with port N); filtered mode generalises that to any expression. The Flows page
uses the same builder for its Traffic over time section (see
Flows).
KPI strip
Total traffic comes from TotalsProvider::fetchTotals() of the datasource
(RRD caches whole-day sums per file, so a long window is not a long rrd_fetch),
read together with the graph data and kept in the tab’s graph cache. The other
three cards (top source, top destination, top protocol) come from the same stored
answer as the top-N card below. While the stored lists do not cover the range, or
collection is off, the cards say so instead of showing a figure.
Precomputed top-N
The top-N card never runs nfdump for a range inside retention. Three pieces produce its answer:
TopNCollector(backend/common/TopNCollector.php) is fed by the import (see Import Pipeline). For every capture file it runs nfdump twice (nfdump takes at most eight-sper run) for nine statistics: source and destination IP, source and destination port, protocol, source and destination AS, input and output interface. It stores the top 50 by bytes per statistic and source.TopNRepository(backend/store/TopNRepository.php) writes those rows totopn_5mand keeps exact hourly and daily sums of them intopn_1handtopn_1d, so every range answer equals summing the five-minute rows grouped by key. An interval is stored with a pending mark, and the collector adds the marked intervals to the sums every 48 intervals; until then a range read takes the marked intervals fromtopn_5m. The only truncation is the per-interval top 50. See SQLite store for the schema.TopNQuery(backend/query/TopNQuery.php) answers a range: the window is rounded down to five minutes and read as[start, end), split into segments (five-minute rows for ranges up to six hours and the ragged edges, whole hours in six-hour chunks, whole UTC days one by one), each a single primary-key range.
The overview-topn action computes the KPI and table answers in a coroutine that
yields between chunks, never in a render, and stores them in OverviewState;
the page posts it from an effect keyed on the window rounded to five minutes, so
a live window asks at most once per interval. Range results are cached in a
64-entry LRU for 300 seconds, invalidated when the profile’s collector
generation moves (after a batch of new intervals is written).
The card labels the lists approx. from per-interval top 50, ranks them by bytes (ordering by packets or flows says ranked by bytes per interval), notes a coverage below 95 %, and says that the global protocol does not apply to them. For windows up to six hours the rows also carry how many intervals each key was in the top 50.
Out of retention
When the window starts before the retention (NFSEN_TOPN_RETENTION_DAYS,
default 31), when collection is off, or when the store is unavailable, the card
offers overview-topn-run (query kind overview-topn): the same statistic from
nfdump with -o csv, over the capture files that still exist. Its share column is
nfdump’s own bytP for that run, so rows and denominator come from the same
files; the stored series usually outlive the captures, and a stored total would
not match.
Colours
Series colours come from theme-colors.js in fixed slots: sources and ports in
their configured order, protocols as TCP 1, UDP 2, ICMP 3 and Other 4. There are
eight slot colours. In a line chart with more series they repeat, dashed for
series 9 to 16 and dotted for 17 to 24; from the 25th on, series are thin neutral
lines. A rank chip in the top-N table takes a slot colour only when its row is a
series of the graph above (protocol rows under the Protocols display, drawn ports
under the Ports display).
Reading a graph with many series
The Ports display draws one line per configured port, and a real port list runs to dozens. Three things keep that readable:
- Hovering a line lifts it and fades the rest, the reliable way to identify one: the palette runs out long before sixty series.
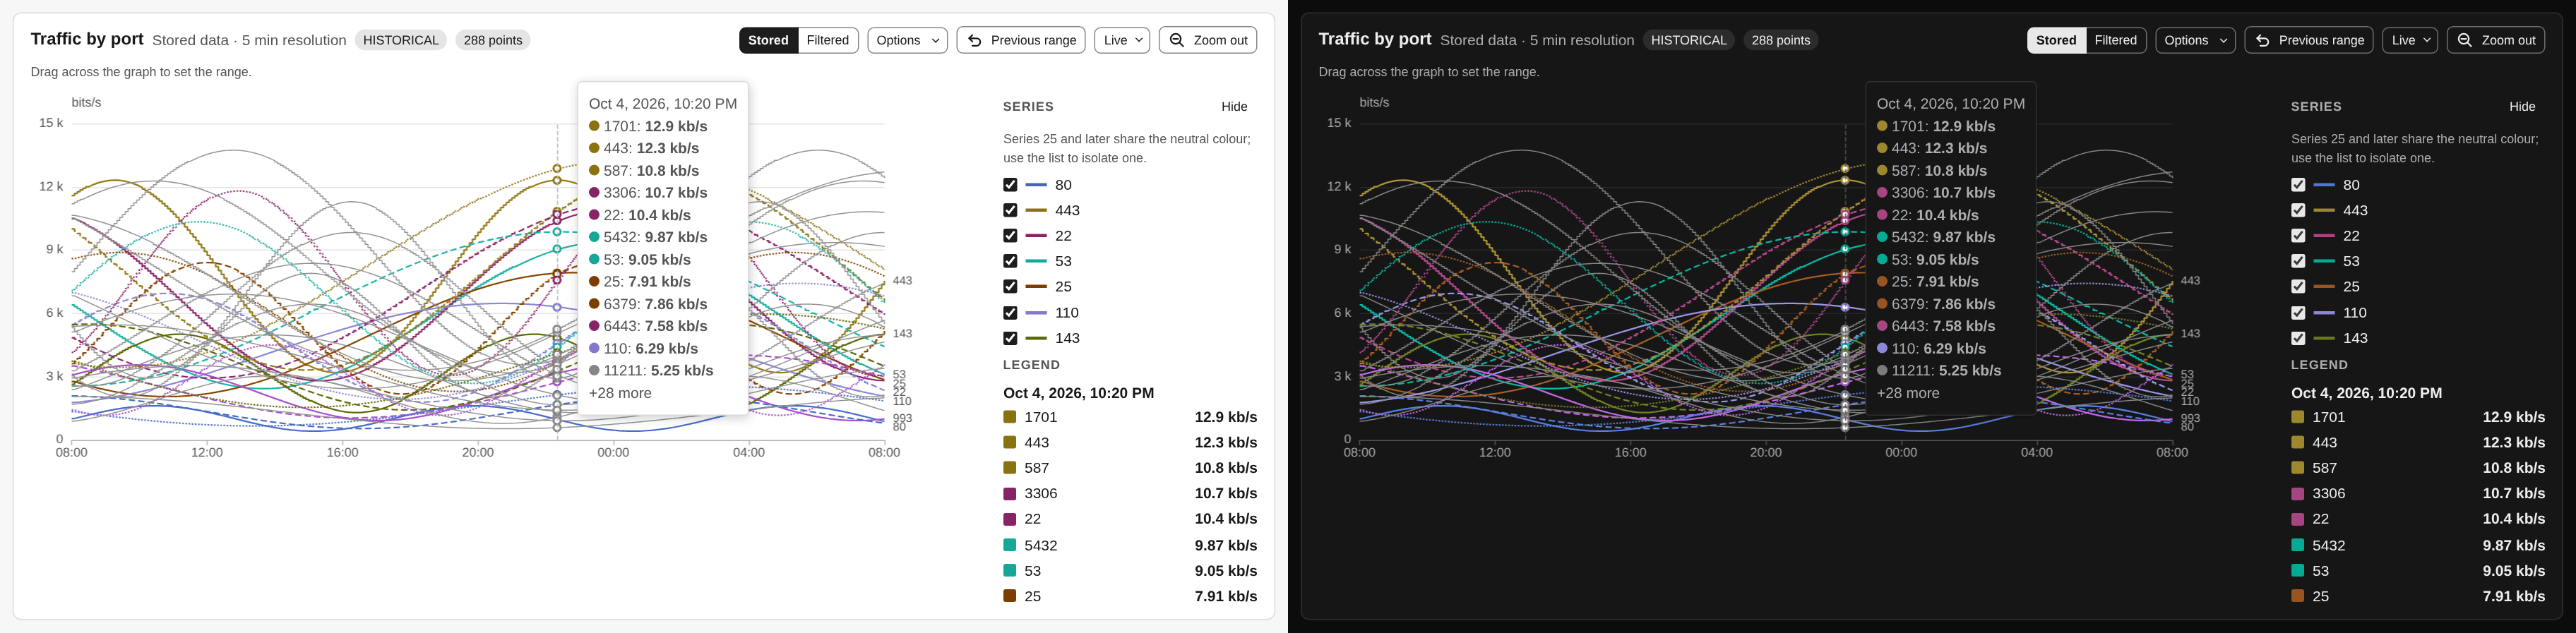
- The tooltip and the Legend list show the largest series first, capped, with a count of the rest.
- The Series list carries a colour swatch per entry and scrolls rather than growing, so it cannot push the chart off the screen.
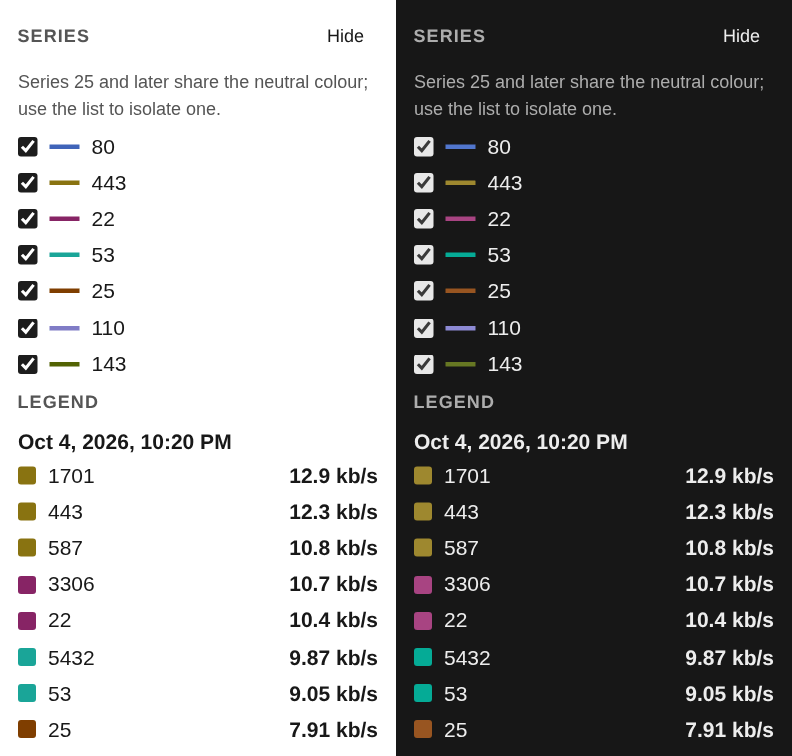
Display controls
Scale, style and line (linear or log, stacked or line, step or curve) are
client-local signals ($_graph_logscale, $_graph_stacked, $_graph_stepplot),
persisted per browser and applied by ECharts without a server round trip. Display
by, data type, ports and resolution are tab signals; changing them posts
refresh-graphs.
Top Talkers
Top-N breakdowns with nfdump’s -s statistics mode, over any element nfdump
supports, plus two side panels for the protocol split and the busiest autonomous
systems. Page: TalkersPage (backend/pages/TalkersPage.php), actions in
StatsActions.php, per-tab state in TalkersState.
The statistic catalog
StatisticCatalog (backend/query/StatisticCatalog.php) is the one list of the
58 statistic elements the page offers, each with its label and its group in the
More statistics select. It also defines:
TABS: the five common statistics as families with a direction (talkersisip,srcipordstip;portsisport,srcportordstport;protocolsisprotoonly;asnsandinterfaceslikewise). The page’sstats_dirsignal (any,src,dst) picks the member.FAMILIES: the same pairing for ToS, masks, VLAN and the NAT address and port elements, so the Direction control works for them too.ORDER_BY:flows,packets,bytes,pps,bps,bpp.stats_orderByis checked against it before it reaches-s <element>/<order>, asstats_foris checked against the catalog.unsupported(): the NEL elements (nevent,nsrcip,ndstip,nsrcport,ndstport) probed once per nfdump binary withnfdump -Z '' -s <element>/bytes. nfdump 1.7.10 exits 1 with Unknown statistic, and the select shows those options disabled with that reason.TalkersPagecaches the answer for 60 seconds per binary.
Choosing a statistic changes signals only. talkers-select re-renders so a
statistic that ran earlier in this tab shows its stored result; nothing runs.
Running a statistic
stats-actions (query kind stats) builds a StatsQuery
(backend/query/StatsQuery.php): -M with the global sources, -R for the
window, -n for Top records, -s <element>/<order>, the byte limits and the
global protocol composed into the filter by FilterComposer, and the window
clamped by NFSEN_MAX_STATS_WINDOW. It runs through QueryRunner with progress
and Kill, and its estimate is estimate-query?target=talkers. The
server-owned _stats_rows signal carries the row count of the stored result,
shown as “N rows returned” when the run finishes.
StatsQuery::runPartitioned() splits a large read into time slices that run as
parallel nfdump processes and merges them exactly (see
Statistics in parallel).
StatsQuery::splittable() decides whether a statistic can be split at all: only
rankings by flows, packets or bytes, and Flow Records only with an -A
aggregation. The estimate counts a split only for a statistic that can take one,
the progress counts files across the parts, and the final status names the
processes the result came from. The side panels split the same way.
The result is stored per statistic in TalkersState, with a fingerprint of its
inputs. The window part of the fingerprint is live:<width> while the range is
live, so a live result does not turn stale by itself; after five minutes the card
says which span it covers instead. The table is sent once through a result host
(see Reactive Loop). Clamp
notices and nfdump’s stderr lines are kept with the result they belong to, and a
cancelled run keeps the statistic’s earlier result.
Each row links its IP-shaped values to the IP info lookup. The
table is nfsen-table with sorting, the Columns menu, CSV/JSON/Print export and
the Enhanced data switch, as on Flows.
Side panels
talkers-panel?panel=proto|as (query kind talkers-panel) runs -o csv -n 10 -s proto/bytes or -s as/bytes with the query card’s filter, byte limits,
window, sources and protocol. MultiStatCsvParser reads the csv, and the panel
stores its bars with the inputs they were computed for, so it can say when the
query card has moved on.
- Protocol share colours its bars with the protocol series slots of the traffic graph (TCP 1, UDP 2, ICMP 3, Other 4).
- Top ASNs comes from nfdump’s
asstatistic, which counts a flow for both of its ends. The bar length halves that (each flow counts half for its source AS and half for its destination AS) so the shares add up; the hover shows nfdump’s byte figure for the AS.
Aggregation
Flow Records ranks whole flows rather than one element of them, so what counts
as one flow is a question only the user can answer. The aggregation controls
are the same partial the Flows page uses (bidirectional, protocol,
source and destination port, per-direction IP with an optional prefix length),
mapping onto nfdump’s -A, or -B for bidirectional.
They appear for Flow Records only, because nfdump applies an aggregation to
that statistic alone and answers every other one with Warning: Aggregation ignored for element statistics. nfdump chooses the column set: aggregating by
destination port yields a table of ports, not of 5-tuples.
Bi-directional is the one query whose output format nfdump chooses for itself:
it prints its merged-flow table as fixed-width text whatever -o it is given.
nfsen-ng reads that table back into columns, so it behaves like any other result
(IP lookups, formatted byte counts, CSV/JSON export), with nfdump’s text one click
away under Original.
Flows
Raw flow-record search: FlowsQuery runs nfdump (see
Nfdump Integration) over the selected
window and the page shows the records as a scrolling list, nfdump’s raw output and a
summary. Page: FlowsPage (backend/pages/FlowsPage.php), actions in
FlowActions.php and FlowGraphActions.php, per-tab state in FlowsState.
Query inputs
| Signal | Effect |
|---|---|
flows_filter | Raw nfdump filter, validated with nfdump -Z while typing (validate-filter?target=flows) |
flows_limit | -c: 20, 50, 100, 500, 1,000 or 10,000 rows |
flows_lower_limit, flows_upper_limit | Byte limits, composed into the filter as bytes > n and bytes < n |
flows_agg_* | Bidirectional, protocol, source/destination port and per-direction IP aggregation with a prefix, mapped onto -a, -A and -B |
flows_orderByTstart | Sorts the returned rows by start time |
The window, the sources and the global protocol come from the controls bar.
FilterComposer parenthesises the user filter, the protocol term and the byte
limits and joins them with and, so an or in the filter cannot escape the byte
limits. A filter starting with - never reaches nfdump’s option parser: the
command passes -- before it.
Estimate and run
The estimate card (estimate-query?target=flows) shows the files, bytes and
seconds of the window before anything runs. Flows is the one kind whose time is an
upper bound: nfdump stops once it has the rows -c asks for, and the estimate
says stops early once the limit is reached. Flows is not clamped by
NFSEN_MAX_STATS_WINDOW, since the limit already bounds it.
flow-actions (query kind flows) runs -o json -c <limit> through
QueryRunner, with progress from the bytes nfdump has read and a Kill. Listings
above 1,000 rows run one at a time per worker, after checking that the worker has
the memory to parse them, so two 10,000-row runs cannot exhaust it together.
The list
The Flows tab is one list of every returned row: Starbase’s sb-virtual-scroll
(#flowRows-<result>, role="table"), which keeps only the rows around the view
in the document. The server keeps the result’s rows per result id in
FlowRowStore (backend/pages/state/FlowRowStore.php): blocks of 64 rows of
rendered cells, compressed, with each column’s raw values and sort keys, under
the same 12 MiB budget as the other stored results. The first 160 rows come with
the page; scrolling asks for windows of at most 500 rows with flows-window, and
each answer patches the list by its id. These requests post only via_ctx: the
sort, the hidden columns, the zone and the rows all come from the tab’s state on
the server (FlowsState), so a window costs a few hundred bytes up and the rows
it holds down. Rows are 38 px high, 30 px with compact tables, and the header
stays on top while the rows scroll.
A header button sorts by its column (flows-sort), stable against the order before
and with empty values last, and the list starts again from the top. The Columns
picker next to the list hides columns (flows-columns, the whole hidden set each
time). Both choices live in the tab’s state and are remembered per browser, so the
next Run starts with them. Tab and Shift+Tab walk the rows one at a time across
windows: the list puts the focus back on the same row when a window refills the
element that had it.
Export (CSV, JSON) and Print are built on the server from the stored rows, in the
list’s order and with its shown columns (flows-export), and the page pulls the
file in 512 KiB pieces (flows-export-chunk) before it saves or prints it. The
Enhanced data switch chooses the text the list shows or the raw values. Print
renders every row in a frame on the page and opens the browser’s print dialog.
Times are written in the browser’s time zone, which the Run sends, or in the capture’s zone when Settings show server time; a zone saved in Settings applies to the next window. Compact tables saved in Settings apply from the next Run. When the server has dropped the rows to make room for other results, the tab says so and asks for a new Run.
Clicking an IP address opens the IP info dialog.
Raw output
The Raw output tab is nfdump’s stdout, untouched on every path, with the command
line (Nfdump::execute() returns a clean command and the notes nfdump printed
beside the data). It is sent in 512 KiB chunks through flows-raw, and the page
keeps the first 5 MiB of a larger output. Copy and Download wait for the chunks.
Summary
A -o json run prints no summary footer, so the Summary tab is built from three
sources:
- Returned rows: flows, packets, bytes, first and last seen, duration and
averages, computed in PHP from the rows (
FlowsQuery::returnedSummary()), labelled as limited by the row limit when it was reached. - Range totals:
TotalsProvider::fetchProtocolTotals()of the datasource, the unfiltered stored totals of the window per protocol. They are read right after the table is sent, from the stored series only. - Filtered totals:
flows-summary-run(query kindflows-summary) runs-o csv -n 0 -s proto/byteswith the full composed filter, without the row limit or aggregation, and sums the protocol rows. It has its own estimate (flows-summary-estimate) and runs only on Compute filtered totals.
Traffic over time
The folded Traffic over time section plots the current flow query over the window, which is what #166 asked for: filter in Flows, then see when those flows happened.
The series is built by the same per-bin builder as Overview’s filtered mode
(FilteredSeries), reading the flow filter with its byte limits, exactly the
expression the table runs. build-flows-graph (query kind flowsgraph) builds
it; touch-flows-graph re-renders after a client-side change (the plotted unit)
and reads nothing.
- The row limit and aggregation options do not apply. Neither changes which records match: one truncates the table, the other regroups its rows. The section says so.
- It never builds on its own. Plotting a filter means one nfdump run per
interval, so the section states what it would read (in 145 nfdump runs) and
waits for Build graph. The runs go side by side, one per free nfdump
process, and Kill stops them all and keeps the intervals that finished.
The window is clamped by
NFSEN_MAX_STATS_WINDOW. - A built graph survives a moving window. The section renders the last build and reports that the query changed, instead of blanking a graph somebody waited for. The comparison rounds to the five-minute slot, so a live window end does not count as a change.
A filtered series has no per-port breakdown: the filter is the port selection.
With several sources selected the split is per source, otherwise per protocol.
The chart carries its own legend, since the section has no series panel. Its
unit and the display timezone of its labels come from data-chart-config, which
the page sets from client signals and lists in the host’s data-preserve-attr,
so a server update does not reset them.
Conversations
The top source and destination pairs of a window, from one nfdump aggregation,
shown as a Sankey, a Matrix and a ranked table. Page: ConversationsPage
(backend/pages/ConversationsPage.php), actions in ConversationActions.php,
per-tab state in ConversationsState.
Inputs
| Signal | Values | Effect |
|---|---|---|
conv_group | ip, net24, net16, port | Group by IP address, /24 or /16 subnet, or IP address through the destination port |
conv_direction | both, forward | Merge both directions of a pair, or keep source to destination |
sankey_metric | bytes, packets | Rank and size by |
sankey_topN | 10, 20, 50, 100, 200 | Pairs to show |
sankey_filter, sankey_lower_limit, sankey_upper_limit | Filter and byte limits, as on the other query pages |
The window, the sources and the global protocol come from the controls bar.
The query
MatrixQuery (backend/query/MatrixQuery.php) runs one nfdump aggregation with
-A per grouping:
| Group by | -A |
|---|---|
| IP address | srcip,dstip |
| /24 subnet | srcip4/24,dstip4/24 |
| /16 subnet | srcip4/16,dstip4/16 |
| Destination port | srcip,dstport,dstip |
ordered by the metric (-O) and limited with -n. A subnet grouping adds an
ipv4 term to the filter, because the masks are IPv4 only, and the page says IPv6
is left out. The window is clamped by NFSEN_MAX_STATS_WINDOW.
Both is a merge in PHP, not an nfdump option: the query fetches four
times the requested pairs as directed pairs (at most 2000), and
ConversationPayload::build() folds a → b and b → a into one pair oriented
from the heavier sender. Pairs near the end of the list may miss reverse traffic
that fell outside the fetch, so the payload is marked approximate. Both is
not available with the port grouping, where a port belongs to one direction; a
request for it falls back to source to destination with a notice.
conversations-run (query kind conversations) runs the query through
QueryRunner, split into parallel time slices when the read is large enough
(MatrixQuery::runPartitioned(), see
Statistics in parallel);
on nfdump 1.7.5, whose plain csv lacks the out counters, it always runs as one
process. A Kill before nfdump starts, or before the result is stored, keeps
the previous result and its notices. conversations-check only recomputes the
server-owned _conv_stale flag and reads no capture files; an effect on the query
card’s signals posts it, so a filter applied from the drawer marks the result
stale too.
The payload
ConversationPayload (backend/query/ConversationPayload.php) turns nfdump’s
rows into one JSON payload that all three views read:
meta: metric, grouping, direction, top N, whether it is approximate, and the nfdump command.totals: every flow the filter matched, read from nfdump’s summary footer.pairs: rank, source, destination, port (an int, or ICMP’stype.codeas a string), bytes, packets, flows, share of the total, and a series slot for the source.others: the traffic outside the top pairs, when the totals are known.
The payload and the IP pairs table are sent once per result through a result host.
Views
Both charts are Rocket elements whose shadow root holds only a <slot>: the
canvas container stays in the light DOM, and the payload arrives as the
data-conversation attribute. A new result replaces the chart hosts with its
result host.
- Sankey (
nfsen-sankey.js, ECharts): source, optional port, and destination columns, with an Others node per column for the traffic outside the top pairs. Nodes stay in rank order with Others last. Colour marks the source node on this page, which is why the traffic graph above shows one neutral total. A click on an address node dispatchesconversation-node, which opens the IP info dialog. ICMP ports are labelledICMP type.code. - Matrix (
nfsen-matrix.js, ECharts heatmap): sources against destinations, coloured with a neutral six-step ramp. A cell outside the ranked pairs is hatched: its traffic is unknown, not zero. With Both, the mirrored cell of a merged pair is left blank rather than hatched. - IP pairs:
Table::generate()with a rank column, both ends as IP links, the port for the port grouping, the figures, and Share (share_pct), which prints as a percentage and exports as the raw fraction with Enhanced data off. The Others line sits below the table.
Export offers the pairs as CSV or JSON, a PNG of the open chart, and the nfdump command.
Filter Builder
The filter builder is a modal <dialog id="filter-drawer"> that edits the nfdump
filter of one query or alert rule. It is a shell module, so every page has it:
FilterDrawer (backend/pages/FilterDrawer.php) declares its signals and fills
the Twig key drawer, the actions are in FilterDrawerActions.php, the template
is backend/templates/drawer/filter-drawer.html.twig and the styles are in
frontend/css/drawer.css. What the user sees is in the
guide.
Targets
The drawer edits one of five targets (FilterDrawer::TARGETS). Each is also a
QueryKit target, and Apply writes into that target’s filter signal:
| Target | Title | Filter signal | Apply and run clicks |
|---|---|---|---|
overview | Overview | graph_filter (the filtered graph) | data-run="overview", the graph’s Apply filter |
talkers | Top Talkers | stats_filter | data-run="talkers" |
flows | Flows | flows_filter | data-run="flows" |
conversations | Conversations | sankey_filter | data-run="conversations" |
alert | Alert rule | alert_form_nfdumpFilter | nothing, the button is hidden |
viewData() returns targets on every render: per target the label, the wire id
of its filter signal and whether it runs. components/filter-field.html.twig
shows the Builder and Saved buttons only for a target listed there.
Opening the drawer
Both buttons dispatch a window event:
window.dispatchEvent(new CustomEvent('nfsen-open-drawer', { detail: { target: 'flows', tab: 'builder' } }));
tab is builder, raw or saved; saved shows the Builder tab and focuses
the saved-filter search. An unknown target is ignored. The dialog’s handler copies
the field’s text into drawer_filter (unless it keeps a draft, see below), sets
drawer_target and drawer_open, calls showModal() and posts drawer-open.
That action clears the status line and checks the text into _flt_drawer; the
sync that follows renders the editor and the saved list.
Rendering
A closed drawer renders only its frame with a Loading filters placeholder.
viewData() reads the grammar and the saved list only while drawer_open is
true, so a closed drawer adds no store read to a render.
drawer-close does nothing but record drawer_open = false, which drops the
list and the grammar from the renders that follow. The dialog carries
data-preserve-attr="open", so a morph does not close it. Below 48em the editor
and the saved list stack instead of standing side by side.
After a saved-filter action, FilterDrawerActions re-renders the tab while the
drawer is open and sends only the changed signals while it is closed. Outcomes
go to _drawer_notice ({id, level, text}), the status line under the saved
list; a notice that arrives while the drawer is closed, as after the browser
import at page load, becomes a toast. A duplicate is a warning and a bad name an
error, and neither is logged; any other failure is logged at LOG_ERR too. Each
action catches \Throwable, so every failure reaches the status line: php-via
would log it and answer 500, which the browser does not show.
Editor and grammar
The Builder tab’s textarea is a plain bound <textarea id="drawerFilterTextarea">.
Next to it sits <nfsen-filter-editor id="drawerEditor" for="drawerFilterTextarea">
(frontend/js/components/nfsen-filter-editor.js), a Rocket element without
children that finds the textarea through for, its suggestion list through
list and its status element through status, and takes the keywords from
grammar. It adds its listeners to the textarea, so the textarea’s own
data-bind and @post handlers stay outside Rocket, and it binds a textarea
that a render replaced when that one gets the focus. The drawer’s other
helpers (opening, the draft, the saved-list search) are plain functions in
frontend/js/components/filter-drawer.js, which loads before the Datastar
bundle because the drawer’s data-init reads them. The Raw filter tab is a
taller plain textarea bound to the same drawer_filter. The grammar comes from
FilterGrammar (backend/query/FilterGrammar.php):
fields(): 18 Basic and 17 Advanced primitives, each with a label, a snippet and a help text. The<ip>,<cidr>,<n>and similar parts of a snippet are placeholders.examples(): eight complete filters with a description.keywords(): every word the snippets spell out, plus protocol names and a few more nfdump words, sorted and unique. The template passes them to the editor in itsgrammarattribute.
A click on a field or an example calls the editor’s insert(), which puts the
snippet at the cursor, adds a space on either side where it touches other text,
and selects the first placeholder. Tab with no suggestion list open selects
the next placeholder after the selection, forward only, so Tab leaves the
textarea once none is left. While the user types, the editor offers up to eight
keywords that start with the word before the caret; Escape closes that list
and not the drawer. Suggestions and insertions are announced through the hidden
status element named by status, because a textarea cannot be a combobox.
FilterGrammar::PLACEHOLDERS holds a sample value for every placeholder.
FilterGrammarTest fills every snippet with them and runs it, and every example,
through nfdump -Z on the real binary, so a snippet nfdump rejects fails the
suite wherever nfdump is installed.
Validation and estimate
Typing posts validate-filter?target=drawer after 300 ms, as in every filter
field, and the answer lands in _flt_drawer (see
Filter validation).
Apply and run is disabled while that answer says invalid or a query is
running.
For a target that runs, the drawer includes components/query-estimate.html.twig
with the target drawer. QueryKitActions::estimateTarget() resolves that to the
target the drawer was opened for, so the estimate uses that query’s kind and
window. Like every estimate it follows the range, the sources and the profile,
not the filter text.
Apply, cancel and drafts
Apply closes the dialog, writes drawer_filter into the target’s filter
signal through Datastar’s signal root by wire id, turns on the field’s status
announcement and posts validate-filter for that target. Apply and run does
the same and then clicks the page’s button with data-run="<target>".
Cancel, Escape and the close button post drawer-close. When the text in
the drawer differs from the field’s, the client signal _drawer_draftFor
remembers the target. The next nfsen-open-drawer for that target keeps
drawer_filter and shows Unapplied draft restored with Discard draft, which
copies the field’s text back and checks it. Opening the drawer for another target
replaces the text with that field’s and forgets the draft, so a browser tab keeps
one draft at a time.
Saved filters
The right-hand column lists SavedFilterRepository::list(); uniqueness, order,
origins and the seeding of presets are described under
SQLite Store. The server sends the whole list,
and the search box hides rows in the browser (nfsenFilterEditor.matches() in
filter-drawer.js, by name or expression, case-insensitive). A filter of origin preference or
deployment carries a preset badge.
| Control | Action |
|---|---|
| Star | filter-star?id=&on=0|1 |
| Menu, Apply | filter-use?id=: loads the expression into drawer_filter, marks the filter used and checks it; the drawer’s Apply then takes it into the field |
| Menu, Edit | In the browser: loads name and expression into the editor and sets drawer_edit; Save changes posts filter-update?id= |
| Menu, Rename | In the browser: sets drawer_rename and shows the name input; Enter posts filter-update?id=&rename=1 |
| Menu, Delete | A browser confirm(), then filter-delete?id= |
| Save current filter | filter-save with drawer_filter and drawer_name; an empty name falls back to the first 60 characters of the expression |
A name has at most 80 characters. When the store cannot be opened, the column shows Saved filters unavailable: and the reason instead of the list, and the actions answer with the same text.
Browser import
At page load the dialog’s data-init reads localStorage['stored_filters'], the
list earlier versions kept in each browser, and posts it to
filter-migrate-local. The browser marks itself done in nfsen-filters-migrated
only after the server acknowledges, and the old list stays where it is; the
contract is in the Actions Reference. The action seeds
the presets first and skips every expression that is a deployment preset, so a
preset the user deleted does not come back through a browser list.
Tests
tests/Unit/FilterGrammarTest.php: the primitives, the examples, the keywords and thenfdump -Zrun above.tests/Unit/FilterDrawerActionsTest.php: every action against an in-memory store, the browser import and the view data for an open and a closed drawer.tests/e2e/drawer.test.mjs: opening from a field, suggestions, inserting and placeholders, validation, saving, renaming, editing, starring, searching, applying, drafts, the stacked layout, deleting, the alert target and the browser import. It saves and deletes its own filters, so it is marked mutating.
Alerts
Threshold rules, evaluated automatically for every five-minute interval as the
import brings it in, on their own Alerts page. Managed by AlertManager
(backend/common/AlertManager.php), with the page in AlertsPage.php and the
actions in AlertActions.php.
Rule shape
| Field | Notes |
|---|---|
| Profile, sources | The nfdump profile, and the sources to sum; none means every configured source, including ones added later |
| Metric | flows / packets / bytes |
| Operator | >, >=, <, <= |
| Threshold type | Absolute value, or percent of a rolling average over a window (10 min to 24 h); see Baseline |
| Cooldown | Five-minute intervals to wait before notifying again while the rule keeps firing |
| Traffic filter | Optional raw nfdump filter expression |
| Notifications | Email and/or webhook (HTTP POST, JSON payload; see libcurl 8.20 and OpenSwoole) |
Rules stay in preferences.json and their runtime state in alerts-state.json:
whether the rule is firing, the remaining cooldown, and the last interval
evaluated. A percent-of-average rule without a baseline is not evaluated for
that interval, and the log says why.
Evaluation per interval
The import daemon calls AlertManager::onFileImported() after each capture file.
Every enabled rule of the profile is evaluated once per interval, when every
configured source has reported that interval or a newer one, whatever the arrival
order. A source that has nothing waiting on disk once a later interval is in
counts as down and is left out until it reports again, so one dead exporter does
not hold back the others. A slot more than two hours behind the newest file
(CATCH_UP_SECONDS, room for the catch-up of a new day directory) stops waiting
for a source that is still importing. The slot is the interval’s start, and
{time} in a notification is that start, in UTC, for Test as well.
- Without a traffic filter, a rule reads each source’s stored value for the
interval right after that source’s import (
fetchLatestSlot()of the datasource) and sums the sources, so the value is the stored rate. - With a traffic filter, it runs one
nfdump -s proto -n 0 -o csvover the interval’s capture files of its sources, with the filter, and adds up the flows, packets and bytes of the protocol rows (AlertManager::sumProtocolRows()). nfdump does the summing, so a busy interval costs the worker no more memory than a quiet one; packets and bytes count the input direction, as nfdump’s per-protocol statistic prints them. The value is a total per five minutes, not a rate, and the form says so. This is what lets a rule watch “ICMP only” or “this one subnet”.
The live evaluation runs its nfdump calls as background work (see
Nfdump Integration):
the import daemon waits for it, so one evaluation waits at most 60 seconds in
total (LIVE_SLOT_BUDGET_SECONDS) for the processes of all its filtered rules. A
rule still without one is left out of that interval with no free nfdump process in the log. Each check runs its own Nfdump instance.
A value that cannot be read (a failed nfdump run, an nfdump output without a
per-protocol statistic, a datasource that does not answer, no baseline yet)
leaves that interval of that rule unevaluated with the reason in the log, rather
than counting it as zero. The rule form validates the
filter with nfdump -Z and refuses to save one nfdump rejects.
fetchCurrentSlot() and testRule() use the same slot and sources as the live
evaluation, so testing a rule and evaluating it behave identically.
Baseline of percent-of-average rules
A percent-of-average rule compares the checked interval with its average over
the window before that interval (AlertManager::baseline()), in the unit of the
value:
- Without a filter, the average comes from the datasource,
fetchRollingAverage($sources, $profile, $window, $slot): per second on RRD, per 5 minutes on VictoriaMetrics, over the window that ends where the checked interval starts. The value is each source’s stored interval,fetchLatestSlot(), which leaves out a source more than one interval behind the newest. - With a filter, the stored series cannot say how much of the traffic the
filter matched, so the rule averages its own values. The live evaluation of an
enabled rule records each checked interval’s total in
alert_samples(AlertSampleRepository), keyed by rule and interval, with a fingerprint of its profile, sources, filter and metric. The baseline is the mean of the samples with the current fingerprint in the window before the checked interval. An empty or failed read records nothing; an interval that matched nothing records 0. Test only reads.
There is no baseline until one earlier interval is recorded, and none while the
average is zero, for either kind. So a filtered rule on traffic that is normally
absent (proto icmp on a quiet link) cannot fire on a burst of it, and a firing
below x % rule stays firing while its filter matches nothing, since those
intervals are not evaluated.
At each check, the profile’s rules drop the samples more than 24 hours older than
the checked interval. An interval checked late keeps the samples after it; those
go only when the clock or NFCAPD_TZ moved back (the rule holds a sample more
than an hour ahead of now and the checked interval is not). Changing a rule’s
profile, sources, filter or metric starts its baseline over from the next import
or check, and deleting a rule drops its samples and its Test events.
Events that filtered percent-of-average rules recorded before the samples existed (schema version 3) keep their threshold, which was a per-second average of all traffic; the history now labels it as a total per 5 minutes.
Fired and resolved
When the condition holds, a rule that was not firing fires: an event is recorded and, unless the cooldown is still running, the notifications go out. While it keeps firing, it notifies again each time the cooldown has run out. When a firing rule finds the condition false on a later interval, it is resolved: that is recorded as an event, and nobody is notified.
Events live in SQLite (alert_events, see SQLite store),
written by AlertEventRepository: fired, resolved and test, with the rule,
profile, sources, metric, operator, value and threshold. The page shows the last
50, newest first, and the rules table reads each rule’s last fired event from
them. Last triggered is an sb-relative-time element (vendored from Starbase):
the server renders the label (12 minutes ago), and the element keeps it
counting while the page is open (now, 30 seconds ago, yesterday, last
week). On hover it shows the date and time with seconds, in the display
timezone: its time-zone attribute is the capture timezone when Settings say so,
and empty (the browser’s) otherwise. The sidebar counts the firing rules (AlertManager::firingCount()). When
the store is unavailable, the history says History unavailable with the reason,
and evaluation and notifications go on.
On the first start after the upgrade, AlertManager::migrateLegacyLog() moves
every entry of the old alerts-log.json into the table as a fired event with
origin migrated, in one transaction that also sets the meta key
migrated.alerts_log, and renames the file to alerts-log.json.migrated. If it
fails, the next start tries again.
Test
test-alert?id= evaluates the rule against the newest complete interval, with
the sources the live evaluation would use, records a test event, and sends the
notifications only when the condition holds. It never touches the rule’s state,
cooldown or samples. The result opens as a dialog rendered into the shell’s modal
root, so live updates do not close it. The dialog shows would fire or would not,
the value and threshold or the reason there are none, the interval, the four
rendered templates, and one line per channel (TestResult['delivery']):
- Sent (the email names its address), when the webhook answered 2xx or
mail()accepted the email; - Failed and why: the webhook’s status or error, or the mail error;
- Not configured, or Not configured on this server for an email while
NFSEN_ALERT_EMAIL_FROMis not set; - Not sent, because the rule would not fire or could not be evaluated.
Test waits up to 10 seconds for the webhook’s answer. A live notification does not wait: it posts from its own coroutine and logs a failed webhook. The reasons name the average window as the form does (the 1 h average).
Actions
| Action | Input | Does |
|---|---|---|
save-alert | the alert_form_* signals | Create or update a rule (by id) |
delete-alert | ?id= | Remove a rule and its state |
toggle-alert | ?id=&enabled=true|false | Switch a rule on or off; without enabled it flips |
test-alert | ?id= | The Test dialog above |
save-alert-templates | the four settings_default*Template signals | Save the global default templates |
Notification templates
Email subject/body and webhook title/message are built from {token} templates.
Resolution is a three-tier fallback in AlertManager::resolveTemplate():
- The rule’s own override (
AlertRule::$emailSubjectTemplate,$emailBodyTemplate,$webhookTitleTemplate,$webhookMessageTemplate; nullable,null= unset, the same convention as$nfdumpFilter). - A global default, stored in
UserPreferences/Settings($defaultEmailSubjectTemplateetc.; plainstring,''= unset) and saved bysave-alert-templates.save-settingsdoes not touch them. AlertManager’s built-inDEFAULT_EMAIL_SUBJECT,DEFAULT_EMAIL_BODY,DEFAULT_WEBHOOK_TITLEandDEFAULT_WEBHOOK_MESSAGEconstants, themselves{token}templates. A golden test inAlertManagerTest.phpasserts that the rendered output for a rule without overrides matches the text these produce.
AlertManager::buildTemplateVars() builds the substitution map (12 tokens; see
the user guide for the
list); substitution is a plain strtr(). {flows}, {packets} and {bytes} are
always all three populated, whatever the rule’s own metric, since one read
returns all three. {sources} lists the configured sources for a rule without a
selection.
The live preview (frontend/js/components/alert-template-preview.js) mirrors this
resolve and substitute logic in the browser with example numbers, so it works for
a new, unsaved rule without a server round trip. The preview <pre> elements
carry data-ignore-morph, like the series and legend lists of the traffic graph
in shell/traffic-graph.html.twig:
they are empty in the server-rendered HTML and filled by data-effect, so without
it the next SSE morph would reconcile them back to the server’s empty version and
wipe the preview.
Health
The Health page (HealthPage, backend/pages/HealthPage.php) collects everything
about keeping the instance running: the import controls, capture freshness per
source, disk usage, a structured audit of the setup, and the recent log. Import
actions are in ImportActions.php.
Where the figures come from
| Card | Source |
|---|---|
| Import | ImportStats (rate), HealthMetrics::sources() (pending files), the daemons’ state, TopNCollector::stats() (queued counts the files being collected too), the Import log of the last pass (its newest 100 entries, with the count of all of them) |
| Capture sources | HealthMetrics::sources(): per profile and source, the newest capture file of the last seven days, how far it is imported, and the files of those seven days still waiting (capped at 10,000) |
| Disk usage | HealthMetrics::disks(): disk_free_space() and disk_total_space() of the capture root, the RRD directory and the state directory, merged per filesystem |
| System | nfdump version, the CPU cores and where the count came from (CpuBudget), the parallel nfdump processes with the -W in use, the slots in use by class (NfdumpSlots), the event-loop lag (LoopLag), process start time, PHP, OpenSwoole and SQLite versions, SQLite journal mode |
| Checks | HealthChecker::run() |
| Recent log | Debug::recent(), the last 200 log lines of this worker from an in-memory ring (LogRing), filtered by level in the browser |
ImportStats keeps the last 100 imports of the worker (from the inotify path, the
directory catch-up and a bulk import alike) and reports files per minute and
milliseconds per file over the last 15 minutes. A source is healthy while its
newest file is less than 12 minutes old (2.4 times nfcapd’s five-minute rotation),
stale after that, no data without a file in seven days, and missing without
a directory.
Caching and refresh
The checks and metrics are shared by every tab in one app-wide cache: recomputed
after 30 seconds while some tab has Health open, after five minutes otherwise (for
the sidebar dot). A render never recomputes them. When a part is due, one
coroutine refreshes it, since the checks scan capture directories, and the tabs
that saw the stale cache are re-rendered when it lands. While Health is open,
health-refresh re-renders it every 10 seconds.
Health check groups
| Group | Covers |
|---|---|
| PHP Extensions | PHP version, ext-openswoole, ext-rrd (only required for the RRD datasource), ext-inotify, pdo_sqlite with the SQLite version |
| Configuration | EnvRegistry::issues() (variables set but invalid, deprecated aliases, unknown NFSEN_ names), malformed url/email values, an active (deprecated) settings.php, a saved log level overriding NFSEN_LOG_LEVEL, and a NFSEN_IPINFO_URL/NFSEN_IPINFO_TOKEN pair that can’t work together |
| Timezone | PHP timezone, NFCAPD_TZ validity, and nfcapd file time: the newest file’s name must match the time it was written (mtime minus 300 s, within 30 minutes) and must not lie in the future |
| nfdump | Binary presence; Minimum version, an error below 1.7.2 (the JSON field names changed from 1.6.x) and a warning below 1.7.10; CPU cores with their source; Parallel processes (with auto, how it was derived); Filter threads (the -W passed); Slots in use by class, recounted on every render |
| Sources | At least one configured |
| Import Daemon | Running / initializing / watching N directories, last auto-import age |
| nfcapd Paths | profiles-data reachable; per profile and source, directory presence, flat or nested layout, and capture freshness |
| RRD Storage / VictoriaMetrics | Delegated to the active Datasource::healthChecks() |
| Storage (SQLite) | From Database::inspect(), which opens the file read-only and never migrates: the file and whether it exists, whether it and its directory are writable, the journal mode (WAL, or the rollback journal where the filesystem refused WAL), the schema version, the size, and the SQLite library (3.33 or later, which the top-N rollups need for UPDATE ... FROM) |
| Disk space | One row per filesystem of the Disk usage card: warning from 85 % used, error from 95 % |
Every entry is ok, warning or error, sorted errors first within its group,
with an optional hint that says what to do about it. The MCP status tool returns
the same checks, the SQLite group included.
The Minimum version warning explains itself by version. Below 1.7.9 its hint names the security fixes of 1.7.9 (the NetFlow v9, IPFIX and sFlow collectors and the reading of malformed capture files); for 1.7.8 and 1.7.9 it adds that gcc builds list the two directions of a flow as separate rows in Bi-directional results. Both end with Upgrade to nfdump 1.7.10.
nfdump processes
NFSEN_NFDUMP_MAX_PROCESSES bounds how many nfdump processes run at once
(auto: a third of the CPU cores, 2 to 8), and NFSEN_NFDUMP_WORKERS sets the
-W of every run. The System card shows the cores (from the CPU affinity, the
container’s CPU limit or the online CPU count), Parallel nfdump processes
(auto, with -W 2; each uses about 2 to 3 CPU cores) and Active queries, the
slots in use against the limit, split into interactive, background and waiting
callers. The nfdump checks list the same with the details: the file the core
count came from, how auto derived the limit or that a variable or settings.php
set it, and the rule background work follows. The limit counts the processes
nfsen-ng started (the import daemon’s and the top-N collector’s included). See
Nfdump Integration
and nfdump processes and CPU cores.
Event loop lag
Every tab of the instance is served by one worker’s event loop, and whatever holds
it (a render, a synchronous file scan, an SQLite write) delays every action, live
update and timer by as long. LoopLag measures that: a timer due every 100 ms
records how late it fired, and a longer stall counts as every tick it swallowed.
The System card’s Event loop lag row shows the p95, the p50 and the maximum
over the last 60 seconds (p95 1.4 ms, p50 0.3 ms, max 9.1 ms, over the last 60
s), and not measured yet right after a start. From a p95 that reads 100 ms the
row carries the warning glyph and screen readers hear Slow:; from 1.0 s the
error glyph and Stalled:. AppStartup starts the probe and stops it on
shutdown.
Import controls
Trigger (trigger-import) re-runs the catch-up scan for one profile.
Backfill (backfill-import, VictoriaMetrics) re-reads every capture file,
including those behind the newest stored sample, and writes each to its slot.
Rescan (force-rescan, RRD) resets the profile’s datasource first, a
destructive re-import behind a confirmation dialog. All three lock the profile’s
ImportDaemon for their duration, so the ongoing inotify poll does not advance
the datasource past where the manual pass has reached, and cancel-import stops
them. Progress ticks are broadcast on the admin:import scope, which also drives
the import chip in the controls bar.
Collect missing top-N now (topn-fill) runs TopNCollector::fillAllGaps() at
once: one newest-first pass over every profile and source of the retention window
that queues up to 500 capture files without a usable interval, and further passes
follow until nothing is missing or a file fails. The collector’s own gap filler
does the same every ten minutes while its queue is empty.
Settings and Timezones
The Settings page (SettingsPage, backend/pages/SettingsPage.php) has one
editable tab, General, backed by preferences.json, and four read-only tabs
that show the deployment: Sources, Storage, Integrations (apart from
the reverse DNS switch) and System. Saving goes through SettingsActions.php.
Preferences
| Section | Fields (UserPreferences) |
|---|---|
| Display | defaultView (a page id), defaultRange (1h, 24h, 7d, 30d, 1y), defaultUnit (bits, bytes), theme ('', system, light, dark), compactTables, displayTimezone (browser, server) |
| Graph defaults | defaultGraphDisplay, defaultGraphDatatype (traffic, packets, flows), defaultGraphProtocols (its first entry seeds the global protocol) |
| Query defaults | defaultFlowLimit, defaultStatsOrderBy |
| Logging | logPriority |
| Integrations | rdnsEnabled |
save-settings takes ?scope=general (the General form) or ?scope=rdns (the
reverse DNS switch); without a scope it writes every General field plus
rdnsEnabled. It merges the posted fields into what preferences.json already
holds (UserPreferences::toArray()), so the alert rules, the alert templates, the
selected profile and any field a scope does not cover are kept. It no longer
writes filter presets (those are saved filters now, see
SQLite store) or the alert templates (their own
action, save-alert-templates).
Legacy values are normalised on load: a defaultView of graphs, statistics,
sankey or investigate becomes its page id (Settings::normalizeView()), and a
defaultGraphDatatype of bytes becomes traffic with defaultUnit set to
bytes.
Compact tables sets <html data-density="compact">, which tightens every
table through the design tokens.
How preferences layer with the deployment
Configuration is applied in two stages: the deployment baseline (environment
variables, then the deprecated settings.php overlay) is built first, and
preferences.json is overlaid on top. For the fields the General tab owns, the
saved preference therefore wins over the deployment value. In particular a
saved logPriority overrides NFSEN_LOG_LEVEL; if you set the log level by
environment variable, leave the preference unsaved or match it. Everything else
(sources, ports, datasource, nfdump paths, import depth, retention, integrations)
comes only from the deployment layer and is shown read-only.
Theme
The theme comes from three layers:
- The browser’s own choice from the sidebar theme menu, in
localStorageundernfsen-theme(light,darkorsystem). Use instance default removes the key. - The instance default, the
themepreference:system,lightordark. An empty value, shown as Deployment default (…), falls through to: NFSEN_DEFAULT_THEME(auto,light,dark;Settings::$deploymentTheme).
The layout puts the instance value on <html data-theme-default>, and a blocking
script at the top of <head> resolves the three layers (and the operating
system’s prefers-color-scheme for system and auto) before the first paint,
so the page never flashes the wrong theme. <html data-theme> is always light
or dark, and the choice follows the OS live while it says system.
Read-only tabs
The Sources, Storage, Integrations and System tabs are read fresh the first time a tab renders Settings and after every save; otherwise they come from an app-wide cache that lives 30 seconds.
Integrations (SettingsPage::viewData()):
| Row | Source | Shown |
|---|---|---|
| Reverse DNS | Settings::$rdnsEnabled | A switch, the only editable row |
| Netbox | NFSEN_NETBOX_URL, NFSEN_NETBOX_TOKEN | Configured when both are set, the URL, the token masked |
| GeoIP (MaxMind) | GeoIpDatabase::status() | Path, database type, build date, Active or the error |
| IP geolocation web service | NFSEN_IPINFO_URL, NFSEN_IPINFO_TOKEN | In use, or standing by while the GeoIP database answers; URL, token masked |
| Alert email sender | NFSEN_ALERT_EMAIL_FROM | The address, or Not configured (email notifications disabled) |
System lists the values in effect with their origin (default, an environment
variable, or settings.php), and every EnvRegistry variable by group with its
value (EnvVar::display() masks secrets), whether it was set, and its
description. When a settings.php is loaded, a notice says its values win.
In effect (SettingsPage::deployment()) includes the nfdump process budget:
Parallel nfdump processes (6, auto on 20 cores), CPU cores with the file or call
they were read from, nfdump filter threads (the -W passed), and nfdump
slots in use by class, which is counted on every render instead of coming from
the 30 second cache.
Timezones
The container runs TZ=UTC. nfcapd file names are parsed in NFCAPD_TZ if set,
the PHP timezone otherwise, independent of the display setting above. If nfcapd
runs in a different timezone than the container, set NFCAPD_TZ explicitly; the
Health page’s nfcapd file time check warns when the newest file’s name is far
from the time it was written, or in the future.
Timestamps travel as Unix epochs and are formatted in the browser, in the
browser’s timezone or, with Capture timezone, in NFCAPD_TZ
(frontend/js/components/tz-utils.js). The absolute range entry in the controls
bar reads and writes times in the same timezone.
IP Info Lookup
Every IP address rendered as a link (<a class="ip-link">, from TableFormatter
in result tables, and from the Overview KPI cards and top-N table, the
Conversations Sankey and IP pairs) posts the ip-info?ip= action
(UtilityActions.php). It renders partials/ip-info-modal.html.twig into
ShellState::$modalHtml, which the layout places in #modal-root, and opens it
as a native <dialog>. The dialog carries data-preserve-attr="open" and its
HTML stays in the tab’s state, so live updates re-render it instead of
closing it.
The dialog has:
-
Hostname:
gethostbyaddr(), falling back to shelling out tohost, and then to a “could not be resolved” label rather than echoing the IP back. With reverse DNS turned off in Settings (rdnsEnabled), no lookup happens and the row says not looked up (reverse DNS is turned off). -
Location, for public IPs only, from one of two sources:
- A local MaxMind database, when
NFSEN_GEOIP_DBpoints at a GeoLite2 or GeoIP2 City or Country.mmdbthat opens.GeoIpDatabase(backend/common/GeoIpDatabase.php) reads it with the pure-PHPmaxmind-db/readerpackage, opens it once per process and reopens it when the file changes; a lookup takes microseconds and makes no network request. The dialog says Source: MaxMind database. An address the database does not know is reported as such, without asking the web service. - A web service, otherwise: ipapi.co by default (city,
region, country, coordinates, timezone, ASN, organisation, whatever it
returns), with a five-second timeout so a slow or unreachable API can’t hang
the dialog. The endpoint is configurable via
NFSEN_IPINFO_URL(plusNFSEN_IPINFO_TOKENfor an API key), since ipapi.co rate-limits anonymous callers; see Configuration. The dialog names the service’s host. A configured.mmdbthat cannot be opened also lands here, and Settings > Integrations says why.
A rate-limit or other error reply is shown as a message rather than an empty table. The country flag is rendered server-side as a regional-indicator emoji (
IpLookup::countryFlag()), so the dialog makes no third-party request of its own. - A local MaxMind database, when
-
Netbox data, for private IPs only, if
NFSEN_NETBOX_URLandNFSEN_NETBOX_TOKENare configured: whatever IPAM record Netbox has for the address (IpLookup::netbox()).
Private versus public is decided once (IpLookup::isPrivate()) and picks exactly
one of geolocation or Netbox: a private (RFC 1918) address is never sent to a
geolocation service, and a public address never triggers a Netbox lookup.
SQLite Store
Time series stay in RRD or VictoriaMetrics. Everything else nfsen-ng keeps that
is not a preference lives in one SQLite database: the per-interval top-N lists,
the saved filters, the alert history, the values filtered alert rules average,
and the recorded query timings. The code is
in backend/store/.
File and driver
The database is <state dir>/nfsen-ng.sqlite, with its -wal and -shm
companions: /var/lib/nfsen-ng/state/nfsen-ng.sqlite in the Docker image,
backend/settings/nfsen-ng.sqlite in a dev checkout or a default bare-metal
install. It needs the pdo_sqlite driver, which the php:8.4-cli base image
ships; bare metal needs php8.4-sqlite3 and phpenmod pdo_sqlite.
SQLite is a hard dependency, but a missing driver or an unwritable state
directory never stops the app. Database::shared() throws
StoreUnavailableException with the path and the reason, remembers the failure
for 60 seconds so a broken store is not retried on every call, and every consumer
degrades: the Overview top-N says Top-N unavailable, the filter builder says
Saved filters unavailable, the alert history says History unavailable, and
estimates fall back to the default read rates. No constructor of a long-lived
object touches the database.
Connection
Database::open() sets:
PRAGMA busy_timeout = 250;
PRAGMA journal_mode = WAL;     -- DELETE when the filesystem refuses WAL
PRAGMA synchronous = NORMAL;
PRAGMA foreign_keys = ON;
PRAGMA temp_store = MEMORY;
FUSE filesystems, such as Unraid’s user shares, can refuse WAL. The store then runs in rollback-journal mode, where reads wait while a write runs; the Health page shows which mode is in use.
Rules for code that uses it
OpenSwoole has no PDO hook, so every SQLite call blocks the worker, and all coroutines of the process share one connection. The binding rules:
- Keep statements small and indexed. Measured on the dev host: a 450-row
insert takes about 1.4 ms, a one-day
GROUP BYabout 5 ms. Query shapes that defeat the primary key (stat BETWEEN, anORof time ranges) are not used, andTopNRepositoryTestasserts the query plans. - Never hold a transaction across a yield. nfdump runs,
scandir, file reads, curl,Coroutine::sleep,broadcastandsyncall yield, and another coroutine would then run inside the open transaction. Do the external work first, then open, write and commit.Database::transaction()wrapsBEGIN IMMEDIATE ... COMMITand rolls back on any\Throwable. - Nothing the size of a range query runs in a render. Actions compute results in a coroutine, in chunks that yield, and store them in the page state; the render reads what they stored.
- Long maintenance runs in batches with a 10 ms pause between them, outside any transaction (pruning, the gap filler).
- PDO binds floats as TEXT. Compare a float with an aggregate or expression as
CAST(? AS REAL), e.g.HAVING SUM(bytes) / 300.0 > CAST(? AS REAL), or the comparison is silently wrong. - Only the server worker migrates or writes. The MCP stdio process never calls
Database::shared(); itsstatustool reads the file throughDatabase::inspect(), which opens it read-only and never creates, migrates or throws.
Migrations
Migrator (backend/store/Migrator.php) runs every migration in
backend/store/migrations/ whose version is above PRAGMA user_version, each in
its own transaction, and then sets user_version. The first Database::shared()
in AppStartup::boot() migrates. M0001Initial is version 1,
M0002QueryRunParts (version 2) adds parts and passes to query_runs, and
M0003AlertSamples (version 3) creates alert_samples. A database with a
newer version than the code knows (after a downgrade) is logged as an error and
used read-only for the tables the code knows; nothing is dropped.
Schema
| Table | Holds |
|---|---|
meta | Key/value pairs: migrated.preference_filters, migrated.alerts_log, deployment_presets.seen, and a topn.pending... mark per stored top-N interval not yet in the hour and day sums |
topn_interval | One row per collected capture file (profile, source, interval start): its flows, packets and bytes from nfdump -I, status (ok, empty, failed), attempts, and the file’s mtime when collected |
topn_5m | The top 50 by bytes per statistic, interval and source: key, flows, packets, bytes |
topn_1h, topn_1d | Exact hourly and daily (UTC) sums of the topn_5m rows, every key |
saved_filters | Name, expression, normalised expression (unique), starred, origin, created, updated, last used, use count |
alert_events | fired, resolved or test, time, rule id and name, profile, sources, metric, operator, value, threshold, origin (live or migrated) |
alert_samples | Per filtered alert rule and checked interval: the value, and a fingerprint of the rule’s profile, sources, filter and metric; the baseline of its percent-of-average threshold, kept 24 hours |
query_runs | Per finished run: kind, time, capture bytes read, files, elapsed milliseconds, ok, the nfdump processes it read with (parts) and whether it read twice (passes) |
The top-N and alert tables are WITHOUT ROWID or indexed on their time columns,
so every range read is a primary-key range.
Top-N data
TopNCollector writes one topn_interval row and up to 450 topn_5m rows (nine
statistics, top 50) per capture file in one small transaction, together with a
pending mark in meta. Every 48 stored intervals it adds the marked intervals to
the hour and day sums, one bucket per transaction, and drops their marks; after
ten minutes without a store, the minute tick flushes the rest and gives way to
the collector between two transactions. A range read takes the marked intervals
from topn_5m, so every answer stays exact while sums are pending. Replacing an
interval (a capture file rewritten, then re-collected) subtracts the old rows
from the sums first and drops sums that reach zero.
Retention is NFSEN_TOPN_RETENTION_DAYS (default 31, 0 disables collection).
The pruner runs five minutes after start and then hourly, and deletes what fell
out of the window in small per-statistic chunks. For sizing, one source over 31
days is about 4 million topn_5m rows, measured at 181 MB; the hour and day
sums each hold at most as many rows as topn_5m (keys that never repeat), and
about 45 % and 38 % of it with typical key churn. Budget about 12 MB per source and day.
Saved filters
SavedFilterRepository keeps one list for the whole instance. Filters are unique
by their normalised expression (trimmed, every whitespace run collapsed to one
space); saving a duplicate raises DuplicateFilterException, which the drawer
shows as Already saved as …. The list is ordered starred first, then by last
use, then by name. origin records where a filter came from: user, browser
(imported from a browser’s local storage), preference (the old Settings
presets) or deployment (NFSEN_FILTERS or settings.php).
SavedFilterSeeder fills the list on the first read per process: the
preference presets once (migrated.preference_filters), and every deployment
preset whose key is not yet in deployment_presets.seen, so a deployment preset
the user deleted stays deleted. Browser lists arrive through the drawer’s
filter-migrate-local action (see Actions Reference).
Query timings
QueryRunner records every finished run in query_runs, and keeps the newest
200 per kind. QueryEstimator turns them into a read rate: the median bytes per
second of the last 20 successful runs of a kind that read at least 32 MiB and took
at least 200 ms, once there are three of them; until then it uses a default rate.
Estimates show measured when they use recorded runs.
Alert events and samples
See Alerts for the events and Baseline for the samples.
Backup
The database is part of the state directory. Stop the app, then copy that directory.
Copying the files while the app runs is not safe: the collector and the alerts
commit while the copy is in progress, and the copied database and -wal can come
from different moments. To back up the running app, let SQLite write a consistent
copy with VACUUM INTO. The image has no sqlite3 shell, so go through PHP:
docker exec nfsen-ng php -r "(new PDO('sqlite:/var/lib/nfsen-ng/state/nfsen-ng.sqlite'))->exec(\"VACUUM INTO '/tmp/nfsen-ng.sqlite'\");"
docker cp nfsen-ng:/tmp/nfsen-ng.sqlite ./nfsen-ng.sqlite
docker exec nfsen-ng rm /tmp/nfsen-ng.sqlite
The target file must not exist yet. On bare metal, run the same php -r line with
the path of your state directory. The copy is a single file; to restore it, stop
the app, put it in place as nfsen-ng.sqlite and delete any -wal and -shm
files next to it.
MCP Server
nfsen-ng ships an optional Model Context Protocol server: read-only access to your NetFlow data for an AI agent, so investigating traffic does not mean writing nfdump filter expressions by hand.
It is off by default. Nothing listens, nothing runs, until you start it or turn the HTTP endpoint on.
What it is for
Triage, not mitigation. During an attack the response is already decided and usually automated, and a model in that path only adds latency. The value is in the minutes before and after, when someone is asking what this traffic actually is: the loop of filter, look, pivot, filter again, which is exactly what an agent is good at.
Running it
The server speaks MCP over stdio, so a client launches it as a subprocess:
php /var/www/html/nfsen-ng/backend/mcp.php
In Docker, point the client at the running container:
{
  "mcpServers": {
    "nfsen-ng": {
      "command": "docker",
      "args": ["exec", "-i", "nfsen-ng", "php", "/var/www/html/nfsen-ng/backend/mcp.php"]
    }
  }
}
stdio means no listening socket and no credentials to manage: whoever can run the command already has access to the data. It also runs as its own process, so an agent’s queries never compete with the web UI for the OpenSwoole worker.
Over HTTP
For an agent that does not live on this host, set NFSEN_MCP_HTTP=true and the same tools are
served at /_mcp, on the app’s own port. That is deliberate: nfsen-ng has no
authentication of its own and is protected by where you deploy it, so an endpoint on a second
port would sit outside whatever guards the dashboard. On the app’s port it inherits that
protection exactly, and there are no separate credentials to manage.
NFSEN_MCP_HTTP=true
NFSEN_MCP_HOSTS=nfsen.example.com    # hostnames a client may address this server as
NFSEN_MCP_HOSTS exists for DNS rebinding protection, which the specification asks for: a
browser tricked into resolving an attacker’s name to your address otherwise reaches a server
that trusts its own network position. Leave it empty and only localhost is accepted, which
is right for a client on the same machine and wrong for anything else. A request whose Host
is not listed gets 403.
With NFSEN_MCP_HTTP off, /_mcp answers 404, the same as any path that does not exist.
The endpoint speaks the stateless revision of the protocol, so there is no handshake and no session: each request carries its own protocol version and client info. Any current MCP client does this for you.
Anything reaching this endpoint can read your flow data, exactly as anything reaching the dashboard can. Whatever protects one has to protect the other.
The two tiers
Every tool states what it costs, because the difference is enormous and a caller that does not know it will burn minutes learning something the graph already knew.
| Tier | Reads | Tools |
|---|---|---|
| Cheap | Stored five-minute aggregates, answers immediately | traffic_timeline, current_load, data_coverage, status, estimate_cost, lookup_address, list_alerts |
| Expensive | Capture files, via nfdump, cost scales with the window | top_talkers, flow_matrix, list_flows |
The intended order is: data_coverage to see what exists, traffic_timeline or
current_load to find when, estimate_cost to price the window, then one of the expensive
tools to find who and what, then lookup_address to turn an address into a device or an
owner.
estimate_cost is deliberately in the cheap tier: it stats capture files rather than reading
them, and exists so an agent can check a window before committing to a scan whose progress it
cannot watch.
Tools
Cheap
traffic_timeline: the series behind the Overview graph, broken down by source, protocol or port, measured in flows, packets, bytes or bits.current_load: the latest interval next to its rolling average, with the multiple between them. The latest interval is each source’s newest stored one, leaving out a source more than one interval behind; the average covers the window before the newest complete interval. A ratio of0means the average is zero, not that traffic stopped.data_coverage: first sample, last sample and last import per source. An import that has not caught up looks exactly like a quiet network; this is how you tell them apart.status: the checks of the Health page (datasource reachability, capture collection, configuration, and the SQLite store, which it inspects read-only), so an infrastructure failure is not reported as a change in traffic.estimate_cost: files, bytes and nfdump runs a window would cost.lookup_address: geolocation and Netbox context for an address, from the local MaxMind database whenNFSEN_GEOIP_DBis set. Private addresses skip the geolocation lookup entirely.list_alerts: the configured rules, to say whether something you found is already covered.
Expensive
top_talkers: top sources, destinations, ports or protocols, ranked by flows, packets, bytes or rate.flow_matrix: source to destination pairs, optionally through a destination port. One loud host and a distributed flood look very different here.list_flows: individual records, for when the aggregate is ambiguous.
Limits
These are enforced by the server, not suggested to the model:
- Time windows are clamped to
NFSEN_MAX_STATS_WINDOW, the same bound the Top Talkers and Conversations pages apply. The answer says when it shortened your range. That setting defaults to0, meaning unlimited, which is reasonable for a person clicking a button and not for an agent that can loop, so with no configured bound these tools fall back to seven days. - Row limits default to 20 and are capped at 500, whatever the caller asks for.
- A byte ceiling of 16 GiB per call refuses a query that would read more capture data than
that, with a message telling the caller to narrow the window or add a filter. It applies
whatever
NFSEN_MAX_STATS_WINDOWis set to. - Filter expressions reach nfdump as a single escaped argument, never interpolated into a shell command. Obvious mistakes such as unbalanced parentheses are rejected with a readable error rather than run.
Alert-triggered triage
The strongest use is asynchronous rather than interactive: an alert fires, an agent investigates while you are still reading the notification, and the summary arrives with the addresses already enriched.
Point a rule’s webhook at a receiver that runs scripts/alert-triage.sh, with the rule’s
webhook template producing JSON that carries the tokens the script reads:
{"rule":"{rule}","sources":"{sources}","time":"{time}","condition":"{condition}"}
The script builds a prompt that walks the tools in the intended order, cheap before expensive, and asks for a short answer that says plainly when the data does not support a conclusion. It is a worked example rather than something nfsen-ng runs: the agent binary, its credentials and where it posts the result are yours to choose.
One detail that decides whether it works at all: an agent started non-interactively cannot ask
anyone to approve a tool, so the tools have to be allowlisted when it launches. The script does
that through ALLOWED_TOOLS, listing only read-only tools. Without it the run ends with
“permission not granted” and no investigation.
Note also that the server needs no credentials of its own. The only credentials involved are the agent’s own access to whichever model it uses.
This runs beside the incident rather than inside it. It does not decide anything and it cannot act, which is what makes it safe to wire up.
What it cannot do
Nothing in the server writes. There is no tool to create an alert rule, trigger an import, change settings or act on the network. The worst case for a compromised or confused client is disclosure of flow data, not control of the installation.
That matters more than it sounds: flow data is a record of who talked to whom, on your network. Treat access to this server as equivalent to access to the web UI.
Actions Reference
There is no separate HTTP/REST API for the UI; see
Reactive Loop for how the pieces fit. Every
server-side operation is one of these named actions. All of them are TAB scoped,
and the URL is <basePath>_action/<name>, the same in every tab: the via_ctx
field of the JSON body tells the server which tab a request belongs to. Templates
always resolve the URL with {{ actionName.url() }} so the base path is right
(the Twig name is the camelCase of the action name, set-range becomes
setRange). A script scrapes via_ctx and the signal ids from the page (see
Environment Notes).
Inputs are either signals, posted as the JSON body the way Datastar sends them, or
query parameters on the action URL (?id=), read with $c->input().
Every action POST needs an Origin header naming the host of the request, as a
browser sends it. Outside dev mode (NFSEN_DEV_MODE) php-via answers a POST
without one with 403 Forbidden: missing Origin, and one whose Origin names
another host than the request’s Host header with 403 Forbidden: untrusted origin, so a reverse proxy has to pass the original Host on.
Shell and controls
| Action | File | Input | Does |
|---|---|---|---|
navigate | ShellActions.php | signal page | Renders the page the client switched to; an unknown page is reset to the default page |
dismiss-notification | ShellActions.php | ?page=<page id>&id=<notice id> | Removes a notice from that page’s state; without a known page, from every page |
kill-nfdump | UtilityActions.php | none | Sends SIGTERM to every nfdump this tab’s query runs (a split query and a filtered graph run several), by query handle (see NfdumpSlots), and names their PIDs; the notice goes to the page that owns query_kind |
ip-info | UtilityActions.php | ?ip= | Renders the IP info dialog into the modal root: reverse DNS, then GeoIP or the web service (public) or Netbox (private) |
set-range | RangeActions.php | ?op=preset&v=1h|24h|7d|30d|1y, ?op=duration&n=6&u=h|d|w, ?op=abs&from=&to= (epoch seconds), ?op=back, ?op=forward, ?op=now, ?op=zoomout, ?op=pin | Moves the global window. Presets, durations and now make it live; back, pin and an absolute window that ends in the past pin it. back is refused at the start of the stored data. Reads no capture file |
apply-globals | RangeActions.php | signals graph_sources, protocol, graph_trafficUnit | Normalises the global sources, protocol and unit, then re-renders |
change-profile | RangeActions.php | signal selected_profile | Switches the nfdump profile, moves the window to the end of its data, saves the choice to preferences.json |
refresh-graphs | GraphActions.php | the graph_* signals | Re-renders the traffic graph for the current options (the live tick) |
validate-filter | QueryKitActions.php | ?target=overview|talkers|flows|conversations|drawer|alert | Checks the target’s filter with nfdump -Z and writes the answer into _flt_<target>; the newest request wins, and a check that cannot run answers Filter could not be checked |
estimate-query | QueryKitActions.php | ?target=overview|overview-topn|talkers|flows|conversations|drawer | Writes _est_<target>: first pending, then files, bytes, seconds, runs, clamp and whether the rate was measured (Estimate::toArray()) |
Overview
| Action | File | Input | Does |
|---|---|---|---|
overview-topn | OverviewPage.php | signals ov_tab, ov_dir, ov_limit, ov_order, and the globals | Computes the KPI cards and the top-N table from the SQLite lists in a coroutine; a second request for the same inputs while one runs is dropped |
overview-topn-run | OverviewPage.php | the same | The exact run with nfdump for a window outside retention (query kind overview-topn), split into parallel time slices when the read is large |
run-filtered-graph | GraphActions.php | signal graph_filter and the graph options | Builds the filtered series behind Apply filter, one nfdump per bin, one bin per free nfdump process (query kind graph) |
Top Talkers
| Action | File | Input | Does |
|---|---|---|---|
stats-actions | StatsActions.php | the stats_* signals (stats_for, stats_dir, stats_count, stats_orderBy, filter, byte limits, aggregation) | Runs the statistic (query kind stats), split into parallel time slices when the read is large, and stores the result for that statistic |
talkers-select | StatsActions.php | signal stats_for | Re-renders only, so a statistic with a stored result shows it; runs nothing |
talkers-panel | StatsActions.php | ?panel=proto|as | Runs a side panel: -o csv -n 10 -s proto/bytes or -s as/bytes with the query card’s filter (query kind talkers-panel) |
Flows
| Action | File | Input | Does |
|---|---|---|---|
flow-actions | FlowActions.php | the flows_* signals | Runs the listing (query kind flows) and stores the result |
flows-window | FlowWindowActions.php | ?result=<id>&offset=<n>&count=<n>, body only via_ctx | Patches the list with rows offset to offset + count (at most 500) in the tab’s order and columns |
flows-sort | FlowWindowActions.php | ?result=<id>&key=<column>&dir=asc|desc, body only via_ctx | Sorts the list, stable, empty values last, and answers from the top |
flows-columns | FlowWindowActions.php | ?result=<id>&hidden=<keys>, body only via_ctx | Hides the named columns (the whole set) and answers with the window the list holds |
flows-export | FlowExportActions.php | ?result=<id>&format=csv|json|print&enhanced=0|1, body only via_ctx | Builds the file from the stored rows and appends an element that pulls it |
flows-export-chunk | FlowExportActions.php | ?export=<token>&chunk=<n>, body only via_ctx | Sends the next 512 KiB of an export |
flows-raw | FlowActions.php | ?result=<id>&chunk=<n> | Sends the next 512 KiB of the raw output |
flows-summary-estimate | FlowActions.php | the query’s signals | The estimate for the filtered totals |
flows-summary-run | FlowActions.php | the query’s signals | Computes the filtered totals of the Summary tab (query kind flows-summary) |
build-flows-graph | FlowGraphActions.php | the query’s signals, flows_graph_unit | Builds Traffic over time for the current filter, one nfdump per interval, one interval per free nfdump process (query kind flowsgraph) |
touch-flows-graph | FlowGraphActions.php | flows_graph_unit | Re-renders after a client-side change; reads nothing |
Conversations
| Action | File | Input | Does |
|---|---|---|---|
conversations-run | ConversationActions.php | conv_group (ip|net24|net16|port), conv_direction (both|forward), sankey_metric, sankey_topN, filter and byte limits | Runs the aggregation (query kind conversations), split into parallel time slices when the read is large. A Kill before nfdump starts or before the result is stored keeps the previous result and its notices |
conversations-check | ConversationActions.php | the same signals | Recomputes _conv_stale only and reads no capture file; an effect on the query card’s signals posts it, so a filter applied from the drawer counts too |
Filter builder
| Action | File | Input | Does |
|---|---|---|---|
drawer-open | FilterDrawerActions.php | signals drawer_target, drawer_filter, drawer_open | Validates the text into _flt_drawer; the render adds the editor and the saved list |
drawer-close | FilterDrawerActions.php | signal drawer_open | Re-renders the closed drawer |
filter-save | FilterDrawerActions.php | signals drawer_filter, drawer_name | Saves the editor’s text, named after itself when unnamed; a duplicate answers with a warning |
filter-update | FilterDrawerActions.php | ?id=, optional &rename=1 | Updates name and expression, or with rename=1 only the name |
filter-delete | FilterDrawerActions.php | ?id= | Deletes a saved filter |
filter-star | FilterDrawerActions.php | ?id=&on=0|1 | Stars or unstars it |
filter-use | FilterDrawerActions.php | ?id= | Loads the expression into the editor and marks the filter used |
filter-migrate-local | FilterDrawerActions.php | signal drawer_import | Imports a browser’s old saved list |
The drawer opens on the window event nfsen-open-drawer with
{target: overview|talkers|flows|conversations|alert, tab: builder|raw|saved};
the filter fields’ Builder and Saved buttons dispatch it.
filter-migrate-local reads drawer_import and always clears it. When the import
ran, or the list held nothing new, it sets the server-owned signal
_drawer_imported to a fresh random id; a post with an empty drawer_import is
not acknowledged, and a failure answers with an error-level _drawer_notice. The
browser sets localStorage nfsen-filters-migrated only when _drawer_imported
changes while its import is pending, so a failed, lost or unanswered post is
retried on the next load.
Alerts
| Action | File | Input | Does |
|---|---|---|---|
save-alert | AlertActions.php | the alert_form_* signals | Creates or updates a rule (by id) |
delete-alert | AlertActions.php | ?id= | Removes a rule and its state |
toggle-alert | AlertActions.php | ?id=, optional &enabled=true|false | Sets a rule on or off; without enabled it flips |
test-alert | AlertActions.php | ?id= | Evaluates the rule against the newest complete interval, records a test event, sends the notifications if it would fire (waiting up to 10 s for the webhook), and opens the result dialog with each channel’s delivery |
save-alert-templates | AlertActions.php | the four settings_default*Template signals | Saves the global notification templates |
Health
| Action | File | Input | Does |
|---|---|---|---|
trigger-import | ImportActions.php | signals admin_target_profile, import_scan_ports | Catch-up import for a profile |
backfill-import | ImportActions.php | the same | Re-reads every capture without resetting, for a datasource that accepts historic writes (VictoriaMetrics) |
force-rescan | ImportActions.php | the same | Resets and re-imports a profile (destructive, confirmation first; RRD) |
cancel-import | ImportActions.php | none | Cancels a running manual import |
topn-fill | ImportActions.php | none | Queues the missing top-N intervals of every profile and source now |
health-refresh | ImportActions.php | none | Re-renders; the 10 s tick while Health is open |
Settings
| Action | File | Input | Does |
|---|---|---|---|
save-settings | SettingsActions.php | ?scope=general|rdns, the settings_* signals and displayTz | Saves the General tab (general), the reverse DNS switch (rdns), or both without a scope; merges into preferences.json, keeping the alert rules and templates |
Query kinds
Every query that reads capture files runs through QueryRunner with a kind, which
the progress signals (query_running, query_permille, query_status,
query_eta, query_kind) report and which decides the page a Kill notice goes
to: graph and overview-topn (Overview), stats and talkers-panel (Top
Talkers), flows, flows-summary and flowsgraph (Flows), conversations
(Conversations). The estimator records every finished run of a kind in
query_runs, with the nfdump processes it read its files with and whether it
needed a second pass. A split run’s query_status counts files (Read 120 of 288
files in 4 nfdump processes), and its final status names the processes.
An MCP client does not use these actions, which are bound to a browser tab’s signals. The optional MCP server exposes ten read-only tools over stdio or HTTP and calls the query layer directly.
Reading an action’s exact contract
The fastest way to see what signals an action reads and writes is the action
closure itself: they’re short, and each starts by pulling its inputs with
$c->getSignal('name') or $c->input('name'). There is no separate schema to
keep in sync with them.
Roadmap
Tracked as GitHub issues.
Open
- #143: v1 broken on FreeBSD. OpenSwoole’s C extension doesn’t build on FreeBSD (openswoole/ext-openswoole#233), and php-via is built on OpenSwoole, so a bare-metal FreeBSD install currently can’t run this at all. Short-term (documenting the limitation in the README/book) is done. Medium-term: whether php-via can be made runtime-agnostic (OpenSwoole vs. Swoole vs. an alternative server) is an open question that needs a php-via-side answer, not just an nfsen-ng one.
Recently shipped
- A new layout (unreleased). A sidebar with Overview, Top Talkers, Flows, Conversations, Alerts, Health and Settings, each with its own address; one controls bar for the range, sources, protocol and unit; and the traffic graph as the range picker above every analysis page. Overview shows key figures and the busiest addresses, ports and protocols from lists collected during import and stored in SQLite. Queries show their cost before they run, filters are checked against nfdump while you type, and a filter builder keeps saved filters on the server. Alerts record resolved events, and Health shows capture freshness, disks and the recent log. See the Quick Tour.
- Several nfdump processes per query (unreleased). The process limit follows
the CPU cores (
auto), user queries go ahead of the import and the top-N collector, and large Top Talkers, Conversations and Overview exact runs, filtered graphs and the top-N backfill run in parallel, with results identical to a single nfdump run. The Docker images ship nfdump 1.7.10, and Health shows the server’s event-loop lag. See Nfdump Integration. - #152: Sankey diagram, done. Conversations shows the top source and destination pairs as a Sankey, a Matrix and a ranked table, grouped by address, /24, /16 or destination port, in one or both directions.
- #166: graphs through an nfdump filter. Overview can plot any filter expression instead of only what the datasource already aggregated, and Flows has a Traffic over time section that plots the flow query you just typed, so “when did this happen” and “what exactly was it” are one screen.
- An optional MCP server, off by default, giving an AI agent read-only access to the same data over stdio or HTTP. Ten tools in two cost tiers, so an agent establishes a window from stored aggregates before reading capture files.
- #171 and #173: import correctness. Backfilling captures older than the install on VictoriaMetrics, per-port databases for ports with no traffic, and a configurable per-port direction for exporters that report one direction of each flow.
- #150: Alerts improvement. Host/subnet and protocol-scoped alerting, implemented as a freeform nfdump traffic filter on a rule (see Alerts) rather than separate host and protocol fields: one field covers an ICMP-only or single-subnet rule.
- The traffic graphs moved from Dygraphs to Apache ECharts, so the whole app shares one charting library.
- Custom-duration time ranges, for windows the presets don’t cover.
- Column visibility and sort order that survive live updates.
- End-to-end browser test suite covering every page (see Testing).