Top Talkers
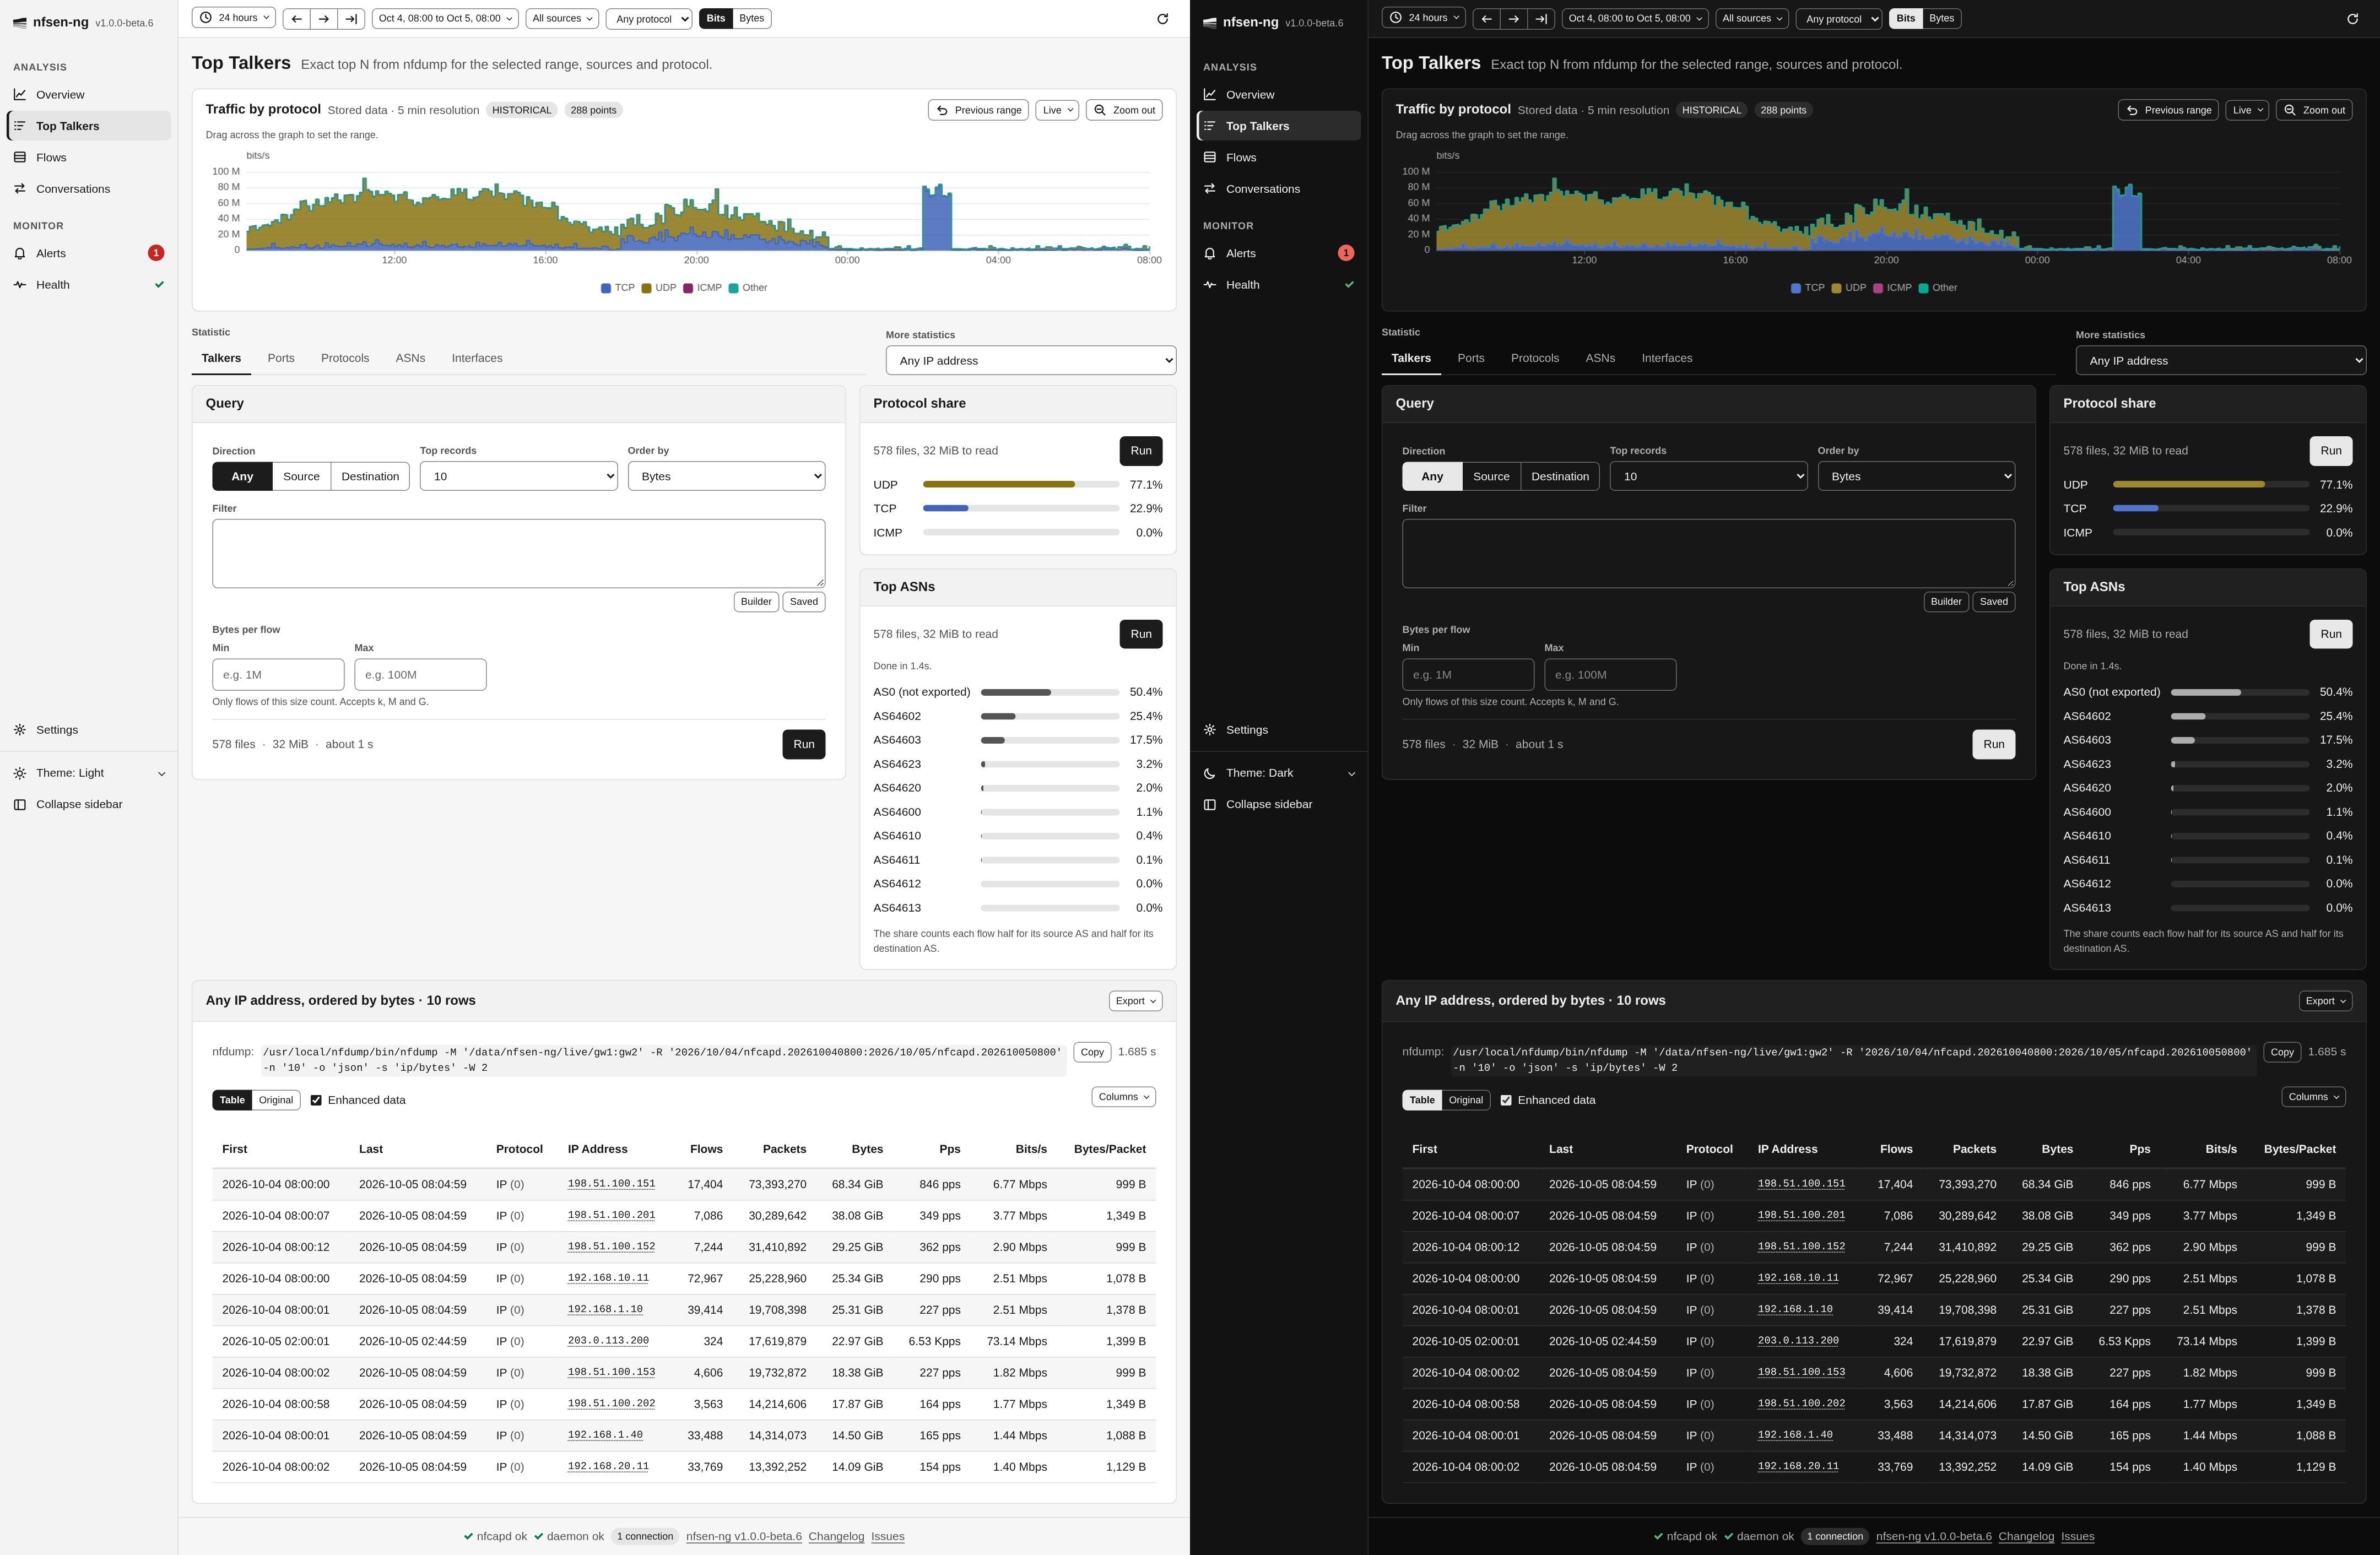
Top Talkers answers “who are the top N?”: the busiest hosts, ports, protocols, autonomous systems or interfaces of the range, ranked and totalled, exactly as nfdump counts them. Overview shows similar lists at no cost, but they are approximate and reach back only a month; this page reads the capture files and is exact for any range they cover.
Choosing a statistic
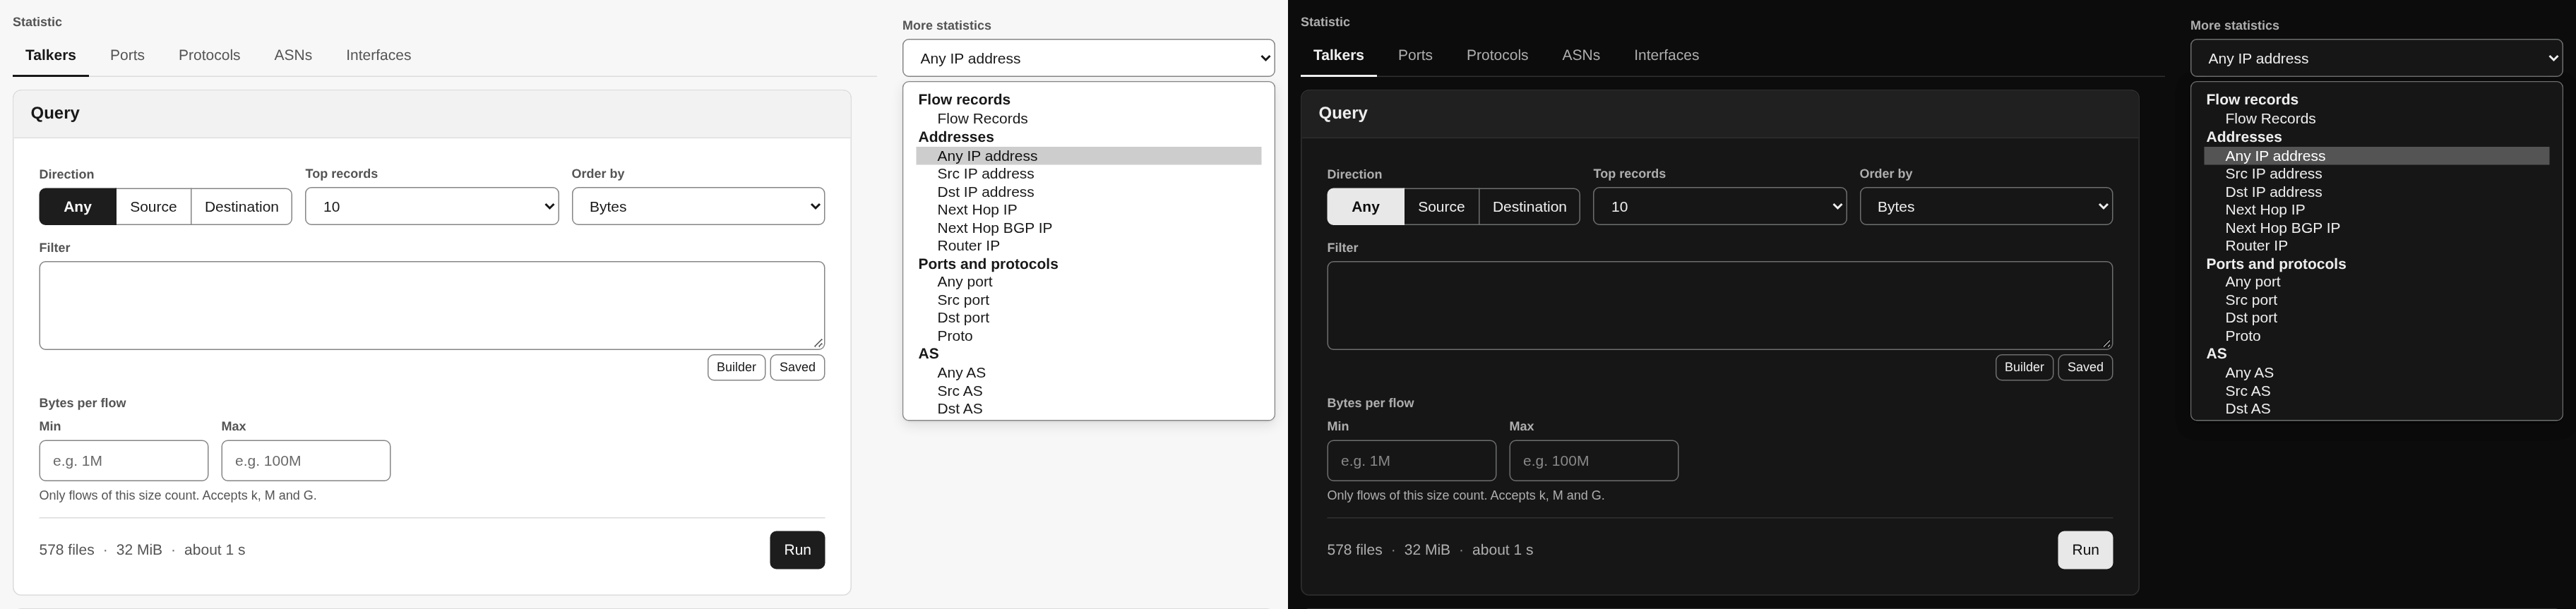
The Statistic row picks the common ones: Talkers (IP addresses),
Ports, Protocols, ASNs and Interfaces. Direction in the query
card decides which side counts: Any, Source or Destination (for
interfaces: in or out; protocols have no direction). Talkers with Destination
is nfdump’s dstip statistic, Ports with Any is port, and so on.
More statistics lists every statistic nfdump offers, 58 in all, in groups: flow records, addresses (including next hop and router), ports and protocols, AS, interfaces, ToS, masks, VLAN, MAC, MPLS, NSEL (Cisco ASA) and NEL (NAT). Statistics that the installed nfdump cannot compute are shown but disabled, marked not supported by this nfdump, with nfdump’s reason in the tooltip. The nfdump 1.7.10 in the Docker image, for example, rejects the five NEL statistics.
Choosing a statistic never runs a query. It shows the estimate for the new statistic, and if you ran that statistic before in this tab, its last result comes back.
Running a query
| Control | What it does |
|---|---|
| Top records | How many rows to return: 10, 20, 50, 100, 200 or 500 |
| Order by | Rank by Flows, Packets, Bytes, Packets per second, Bits per second or Bytes per packet |
| Filter | Any nfdump filter, checked as you type; Builder and Saved open the filter builder |
| Bytes per flow | Only flows between Min and Max bytes count (accepts k, M and G) |
| Aggregation | For Flow Records only, see below |
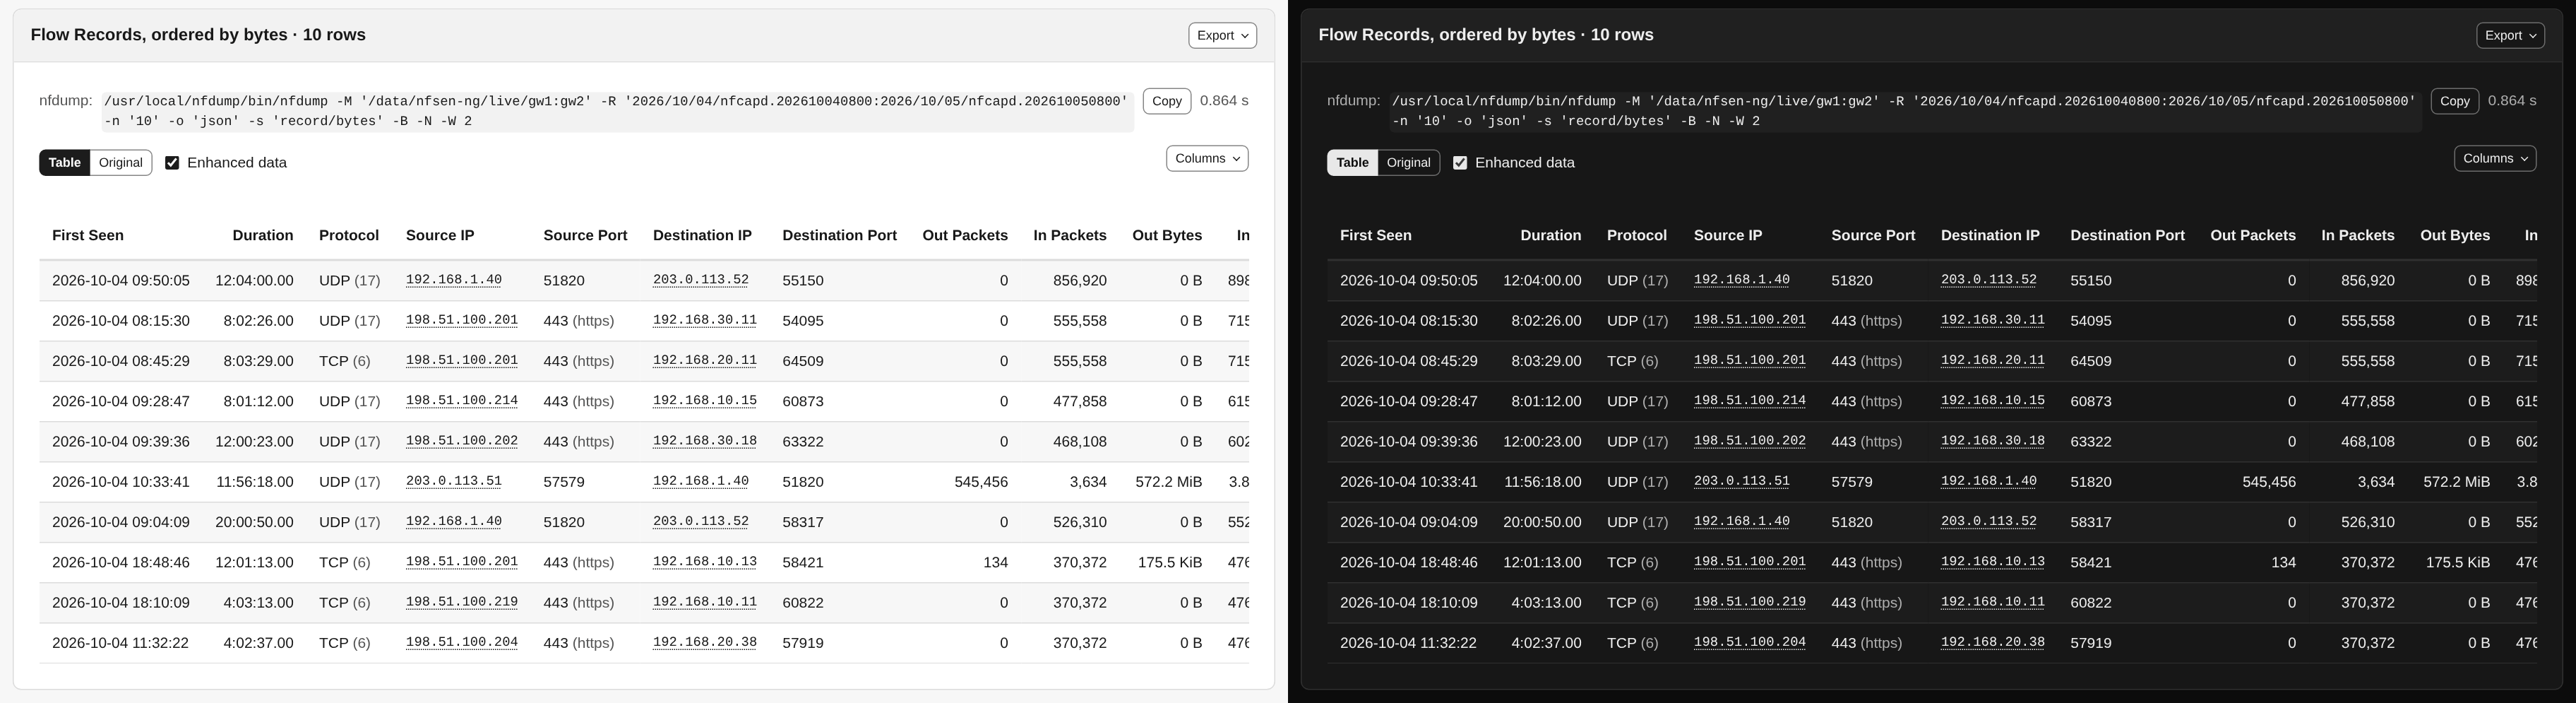
The range, the sources and the protocol come from the controls bar. Check the estimate, then press Run. The result card is titled with what it ranks (Dst IP address, ordered by bytes) and shows the exact nfdump command it ran, with a Copy button and the time it took.
A large query runs faster on a server with several nfdump processes: nfsen-ng splits a read of more than a second over at least 12 capture files into time slices, runs one nfdump per slice at the same time and merges them into exactly the rows a single run prints. The progress then counts files (Read 120 of 288 files in 4 nfdump processes), and the status says Done in 3.1s with 4 nfdump processes. Rankings by a rate (packets or bits per second, bytes per packet) and Bi-directional always run as one process.
The table sorts by any column, and Columns hides the ones you don’t need (remembered by this browser). Export saves the rows as CSV or JSON or prints them; with Enhanced data on, the export has the formatted values as shown, otherwise the raw numbers. Click an IP address to look it up.
Warnings that belong to a result stay with it: a window shortened by
NFSEN_MAX_STATS_WINDOW, or what nfdump printed on its error output, such as a
truncated capture file. A run you Kill keeps the previous result of that
statistic.
Protocol share and top ASNs
Two cards beside the query answer the questions that usually come next, each with its own Run and the size of what it will read:
- Protocol share splits the bytes of the query into TCP, UDP, ICMP and the rest, as bars in the graph’s protocol colours. With a protocol chosen in the controls bar the answer is trivial, and the card says so.
- Top ASNs lists the busiest autonomous systems. Its share counts each flow half for its source AS and half for its destination AS; point at a bar for nfdump’s byte count of that AS.
Both use the filter, byte limits, range, sources and protocol of the query card. When those change after a run, the card says its result is for an earlier query.
Aggregating flow records
Flow Records ranks whole flows rather than one element of them, so what counts as one flow is a question only you can answer: every distinct 5-tuple, everything to the same port, or everything between two /24s. The Aggregation controls answer it, and they are the same ones the Flows page uses: bidirectional, protocol, source and destination port, and per-direction IP with an optional prefix length.

They appear for Flow Records only, because nfdump applies an aggregation to that statistic alone. The columns change with the aggregation: aggregating by destination port yields a table of ports, because the fields you did not aggregate on no longer identify a row.
Bi-directional merges both directions of a conversation into one row: the
request and its answer become one flow record with In and Out counters
and Flows 2. It is the one query whose output format nfdump chooses for
itself: it prints its merged-flow table as fixed-width text whatever -o it is
given. nfsen-ng reads that table back into columns, so it behaves like any other
result, with nfdump’s text one click away under Original. It needs nfdump
1.7.10: a gcc build of 1.7.8 or 1.7.9 lists the two directions as separate rows
with an empty Out side, and the Health page warns about it.