Conversations
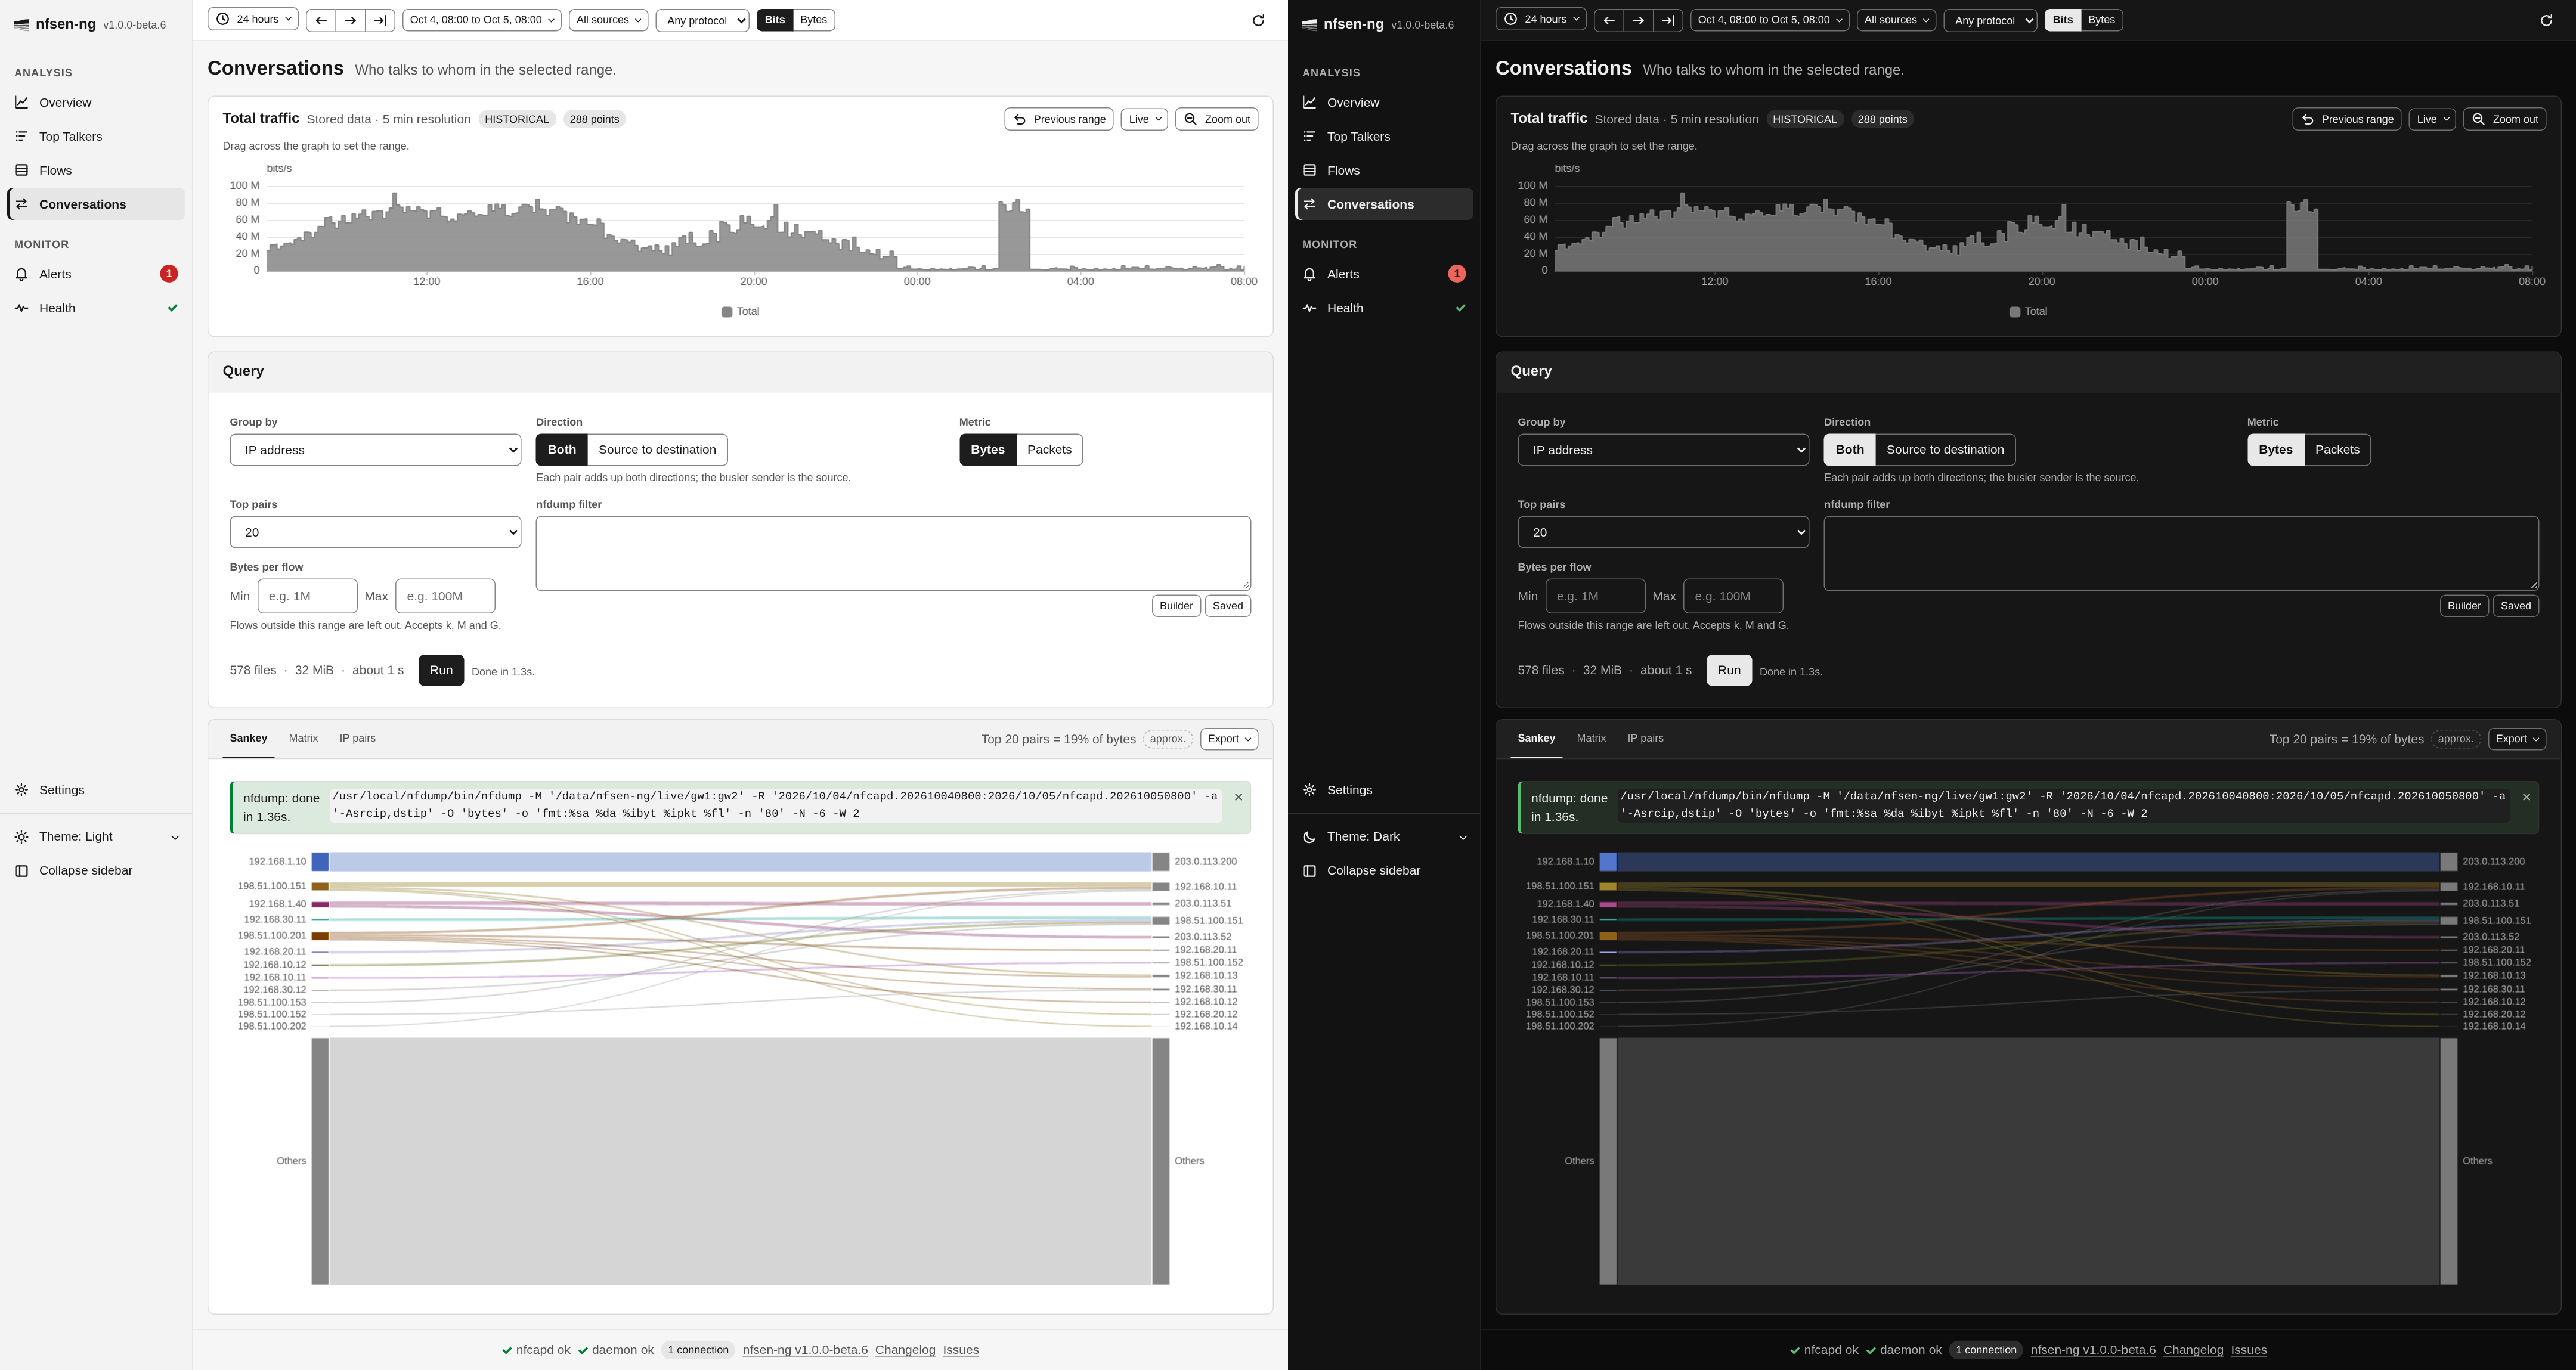
Conversations shows who talks to whom: the busiest source and destination pairs of the range, drawn three ways from one query. The widest band, the darkest cell and the first row are the same conversation.
When to reach for this instead of Top Talkers
Top Talkers ranks addresses one side at a time: “top 10 source IPs” and “top 10 destination IPs” are two separate lists. Conversations shows the relationship between them, which sources drive traffic to which destinations, without cross-referencing two tables yourself.
Running a query
| Control | What it does |
|---|---|
| Group by | IP address, /24 subnet, /16 subnet, or Destination port (source IP to port to destination IP) |
| Direction | Both adds up both directions of each pair; Source to destination keeps each direction as its own pair |
| Metric | Rank and size by Bytes or Packets |
| Top pairs | How many pairs to show: 10, 20, 50, 100 or 200 |
| nfdump filter | Any nfdump filter, checked as you type |
| Bytes per flow | Leave out flows below Min or above Max bytes (accepts k, M and G) |
The range, the sources and the protocol come from the controls bar. Check the estimate and press Run.
A few combinations have rules. Both is not available with Destination port, because a port belongs to one direction. With Both, the busier sender of a pair becomes its source; nfsen-ng merges the directed pairs itself, from four times as many as you asked for (at most 2000), so a pair near the end of a long list can miss part of its reverse traffic, and the summary line then carries an approx. badge. Subnet grouping covers IPv4 only, and the card says so.
Past a certain count the Sankey gets crowded rather than more useful, so start with 10 or 20 pairs and widen only if you need to.
Reading the result
The line above the views sums up the result, e.g. Top 20 pairs = 64% of bytes. The tabs switch between three views of the same pairs.
Sankey draws each pair as a band from its source to its destination, as wide as its bytes or packets. The traffic outside the top pairs becomes an Others node in each column, so the diagram accounts for all the traffic the query matched. Click an address to look it up.
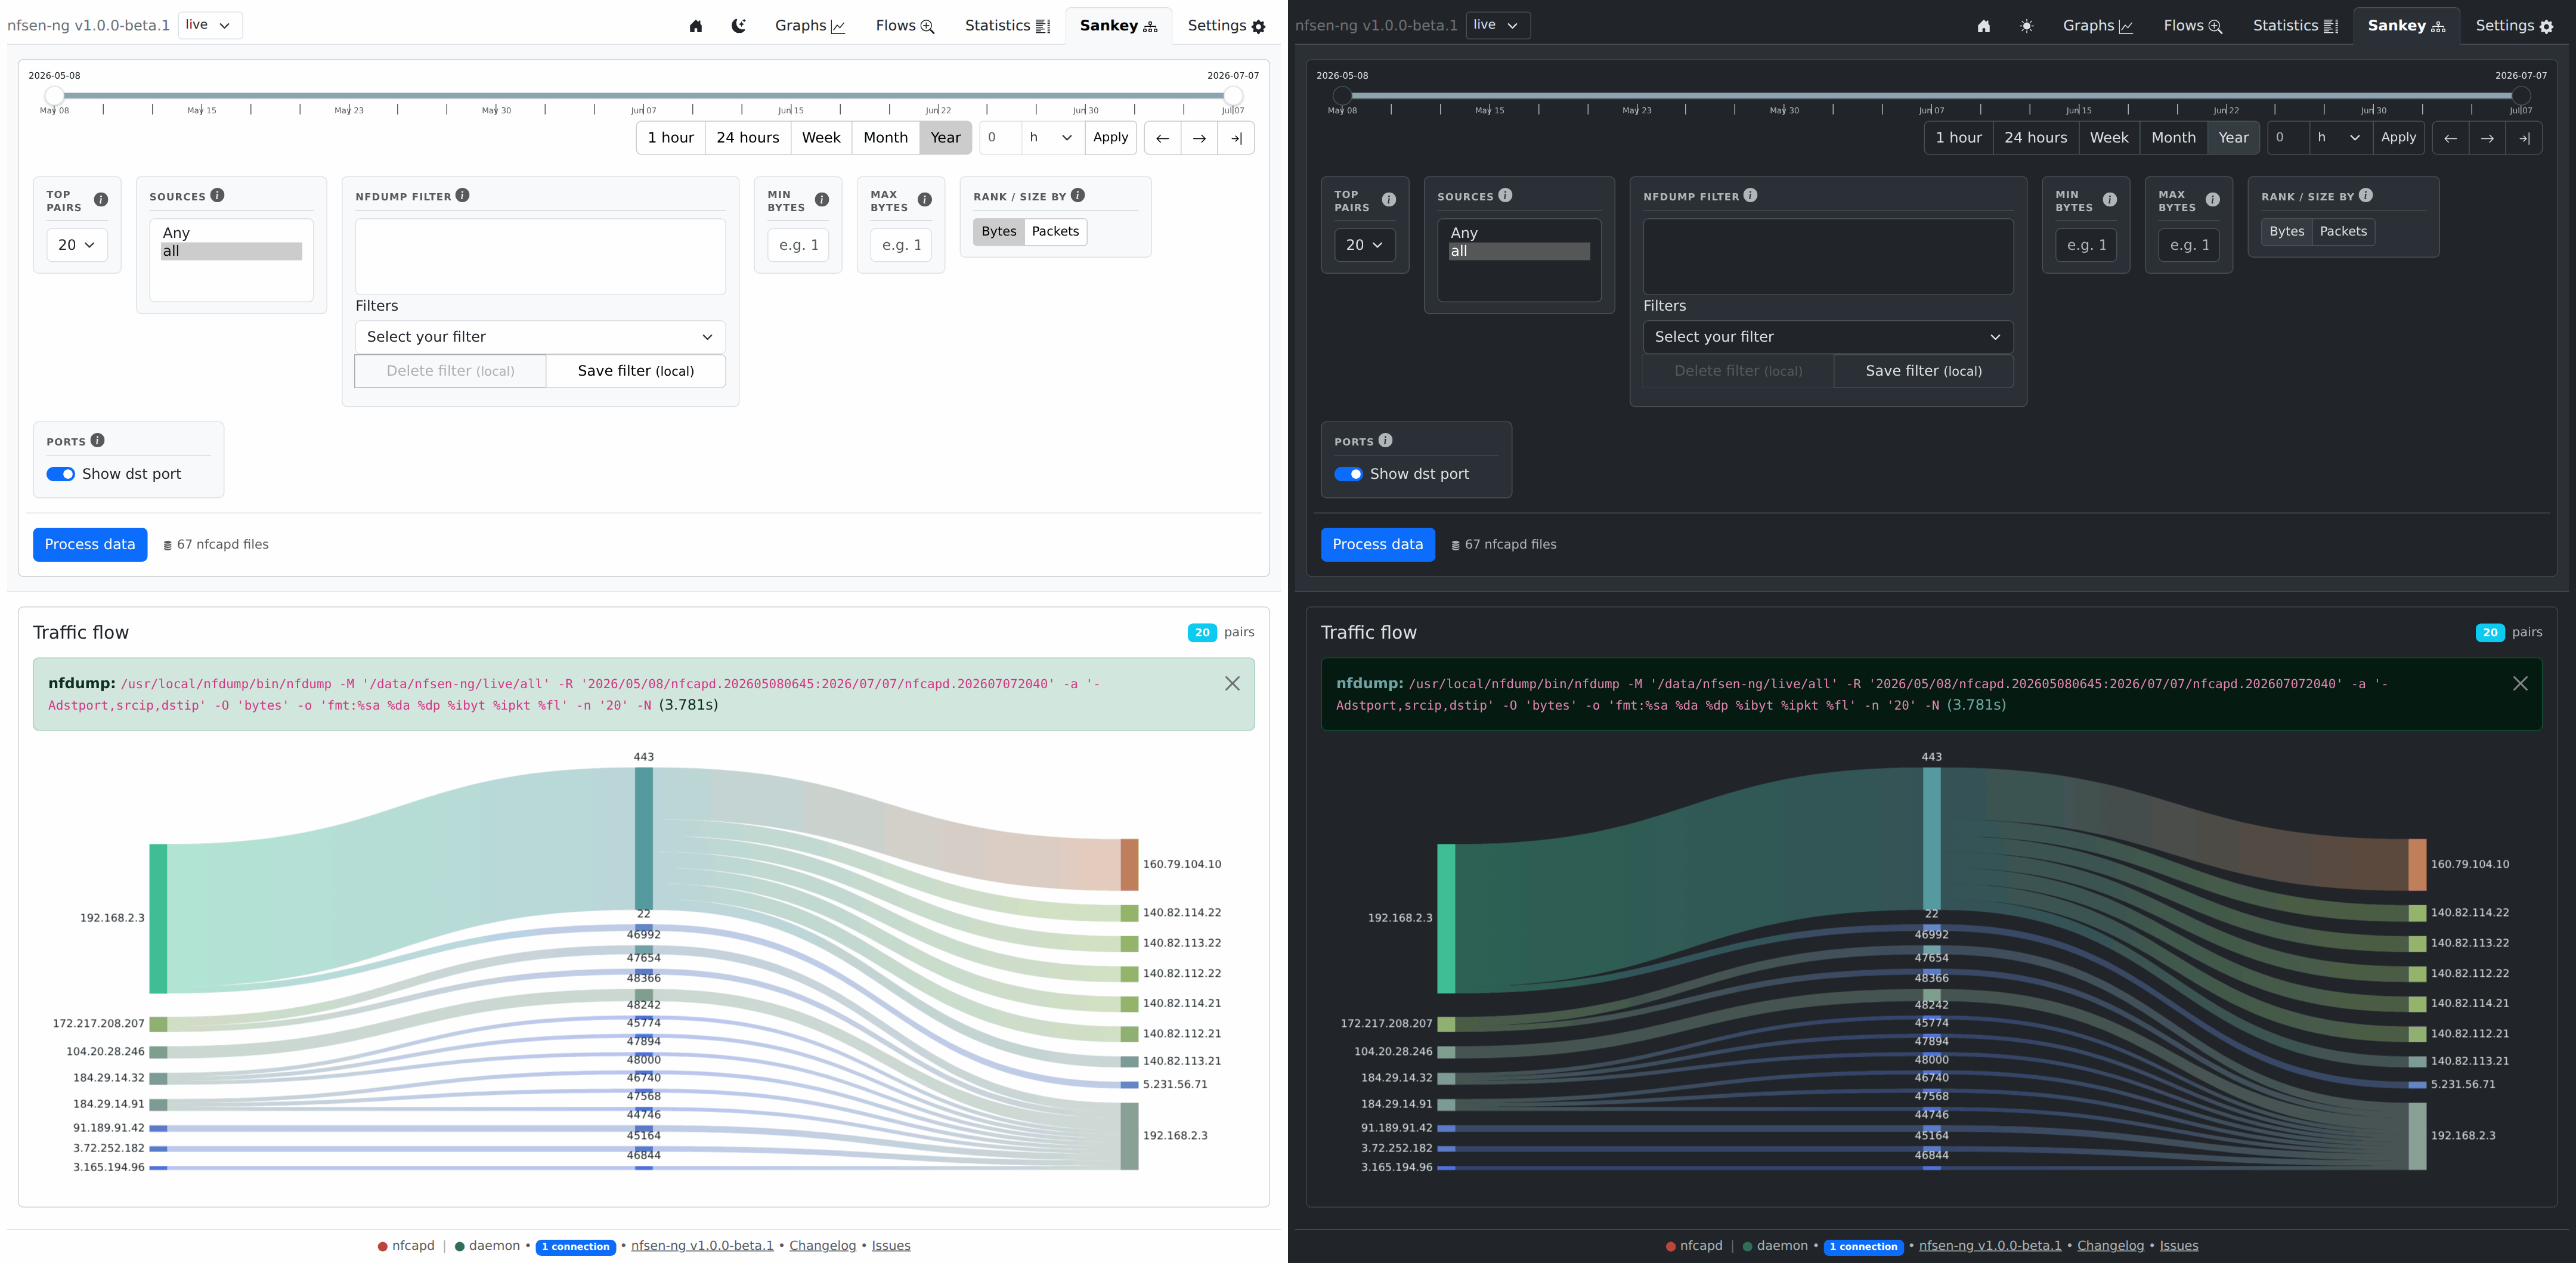
With Destination port, the Sankey gets a middle column: source IP → port →
destination IP. That answers which service a conversation used, e.g. that one
host’s traffic to a server is all 443 while another’s is 22. The port column
pools traffic per port, so a busy port shows up as one thick node fed by every
source and fanning out to every destination that used it. ICMP has no ports;
its flows appear as ICMP type.code, such as ICMP 8.0 for echo requests.
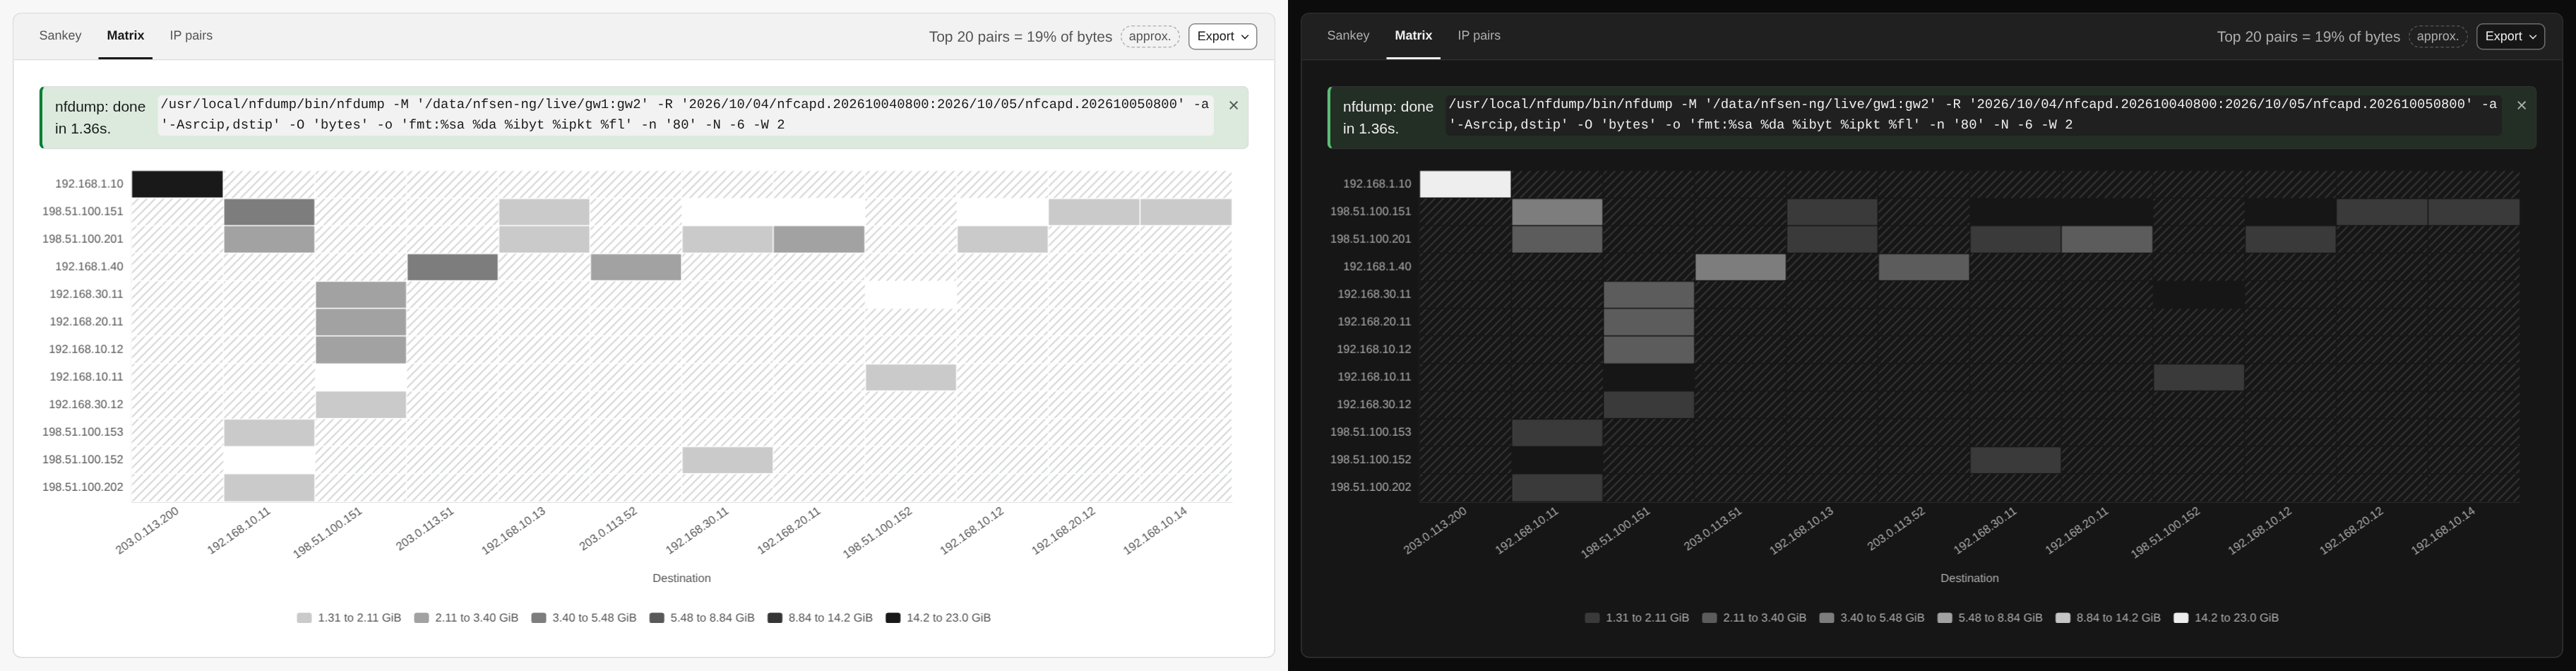
Matrix puts the sources on one axis and the destinations on the other, with a darker cell for more traffic. A hatched cell is a pair outside the top pairs: its traffic is unknown, not zero. Point at a cell for the figures.
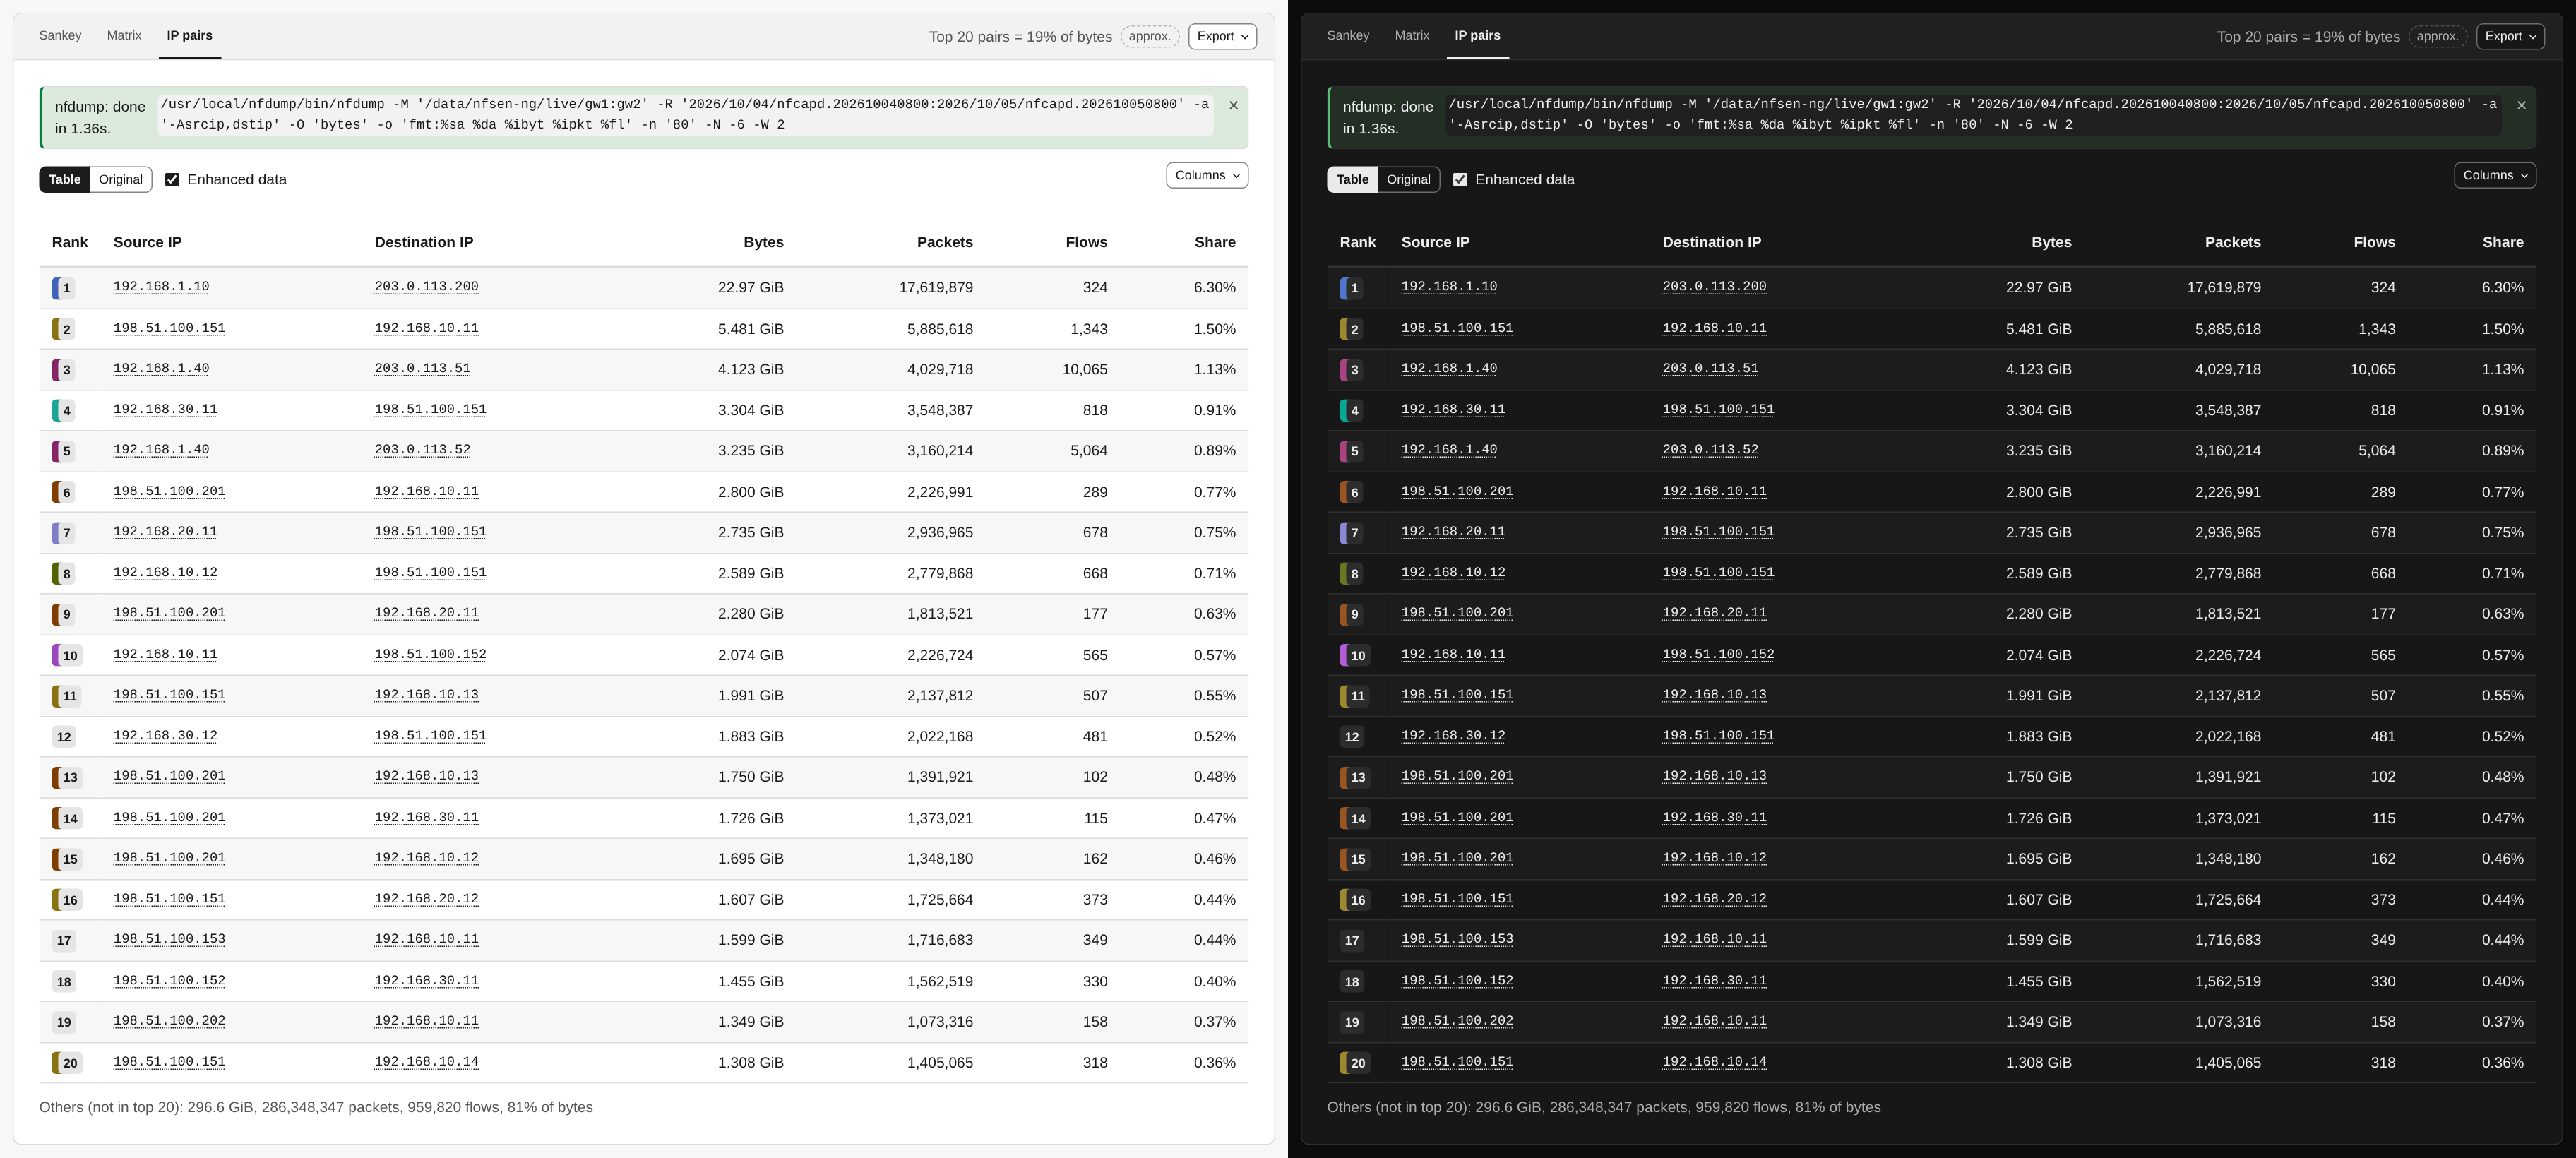
IP pairs is the ranked table, with bytes, packets, flows and each pair’s Share of the total. Below it, Others sums up the traffic outside the top pairs. Addresses link to the IP lookup.
Exporting
Export offers the IP pairs as CSV or JSON, a PNG of the Sankey or the Matrix (whichever is open), and Copy nfdump command. The exported Share is a percentage with Enhanced data on, and the raw fraction with it off.