Health
The Health page (HealthPage, backend/pages/HealthPage.php) collects everything
about keeping the instance running: the import controls, capture freshness per
source, disk usage, a structured audit of the setup, and the recent log. Import
actions are in ImportActions.php.
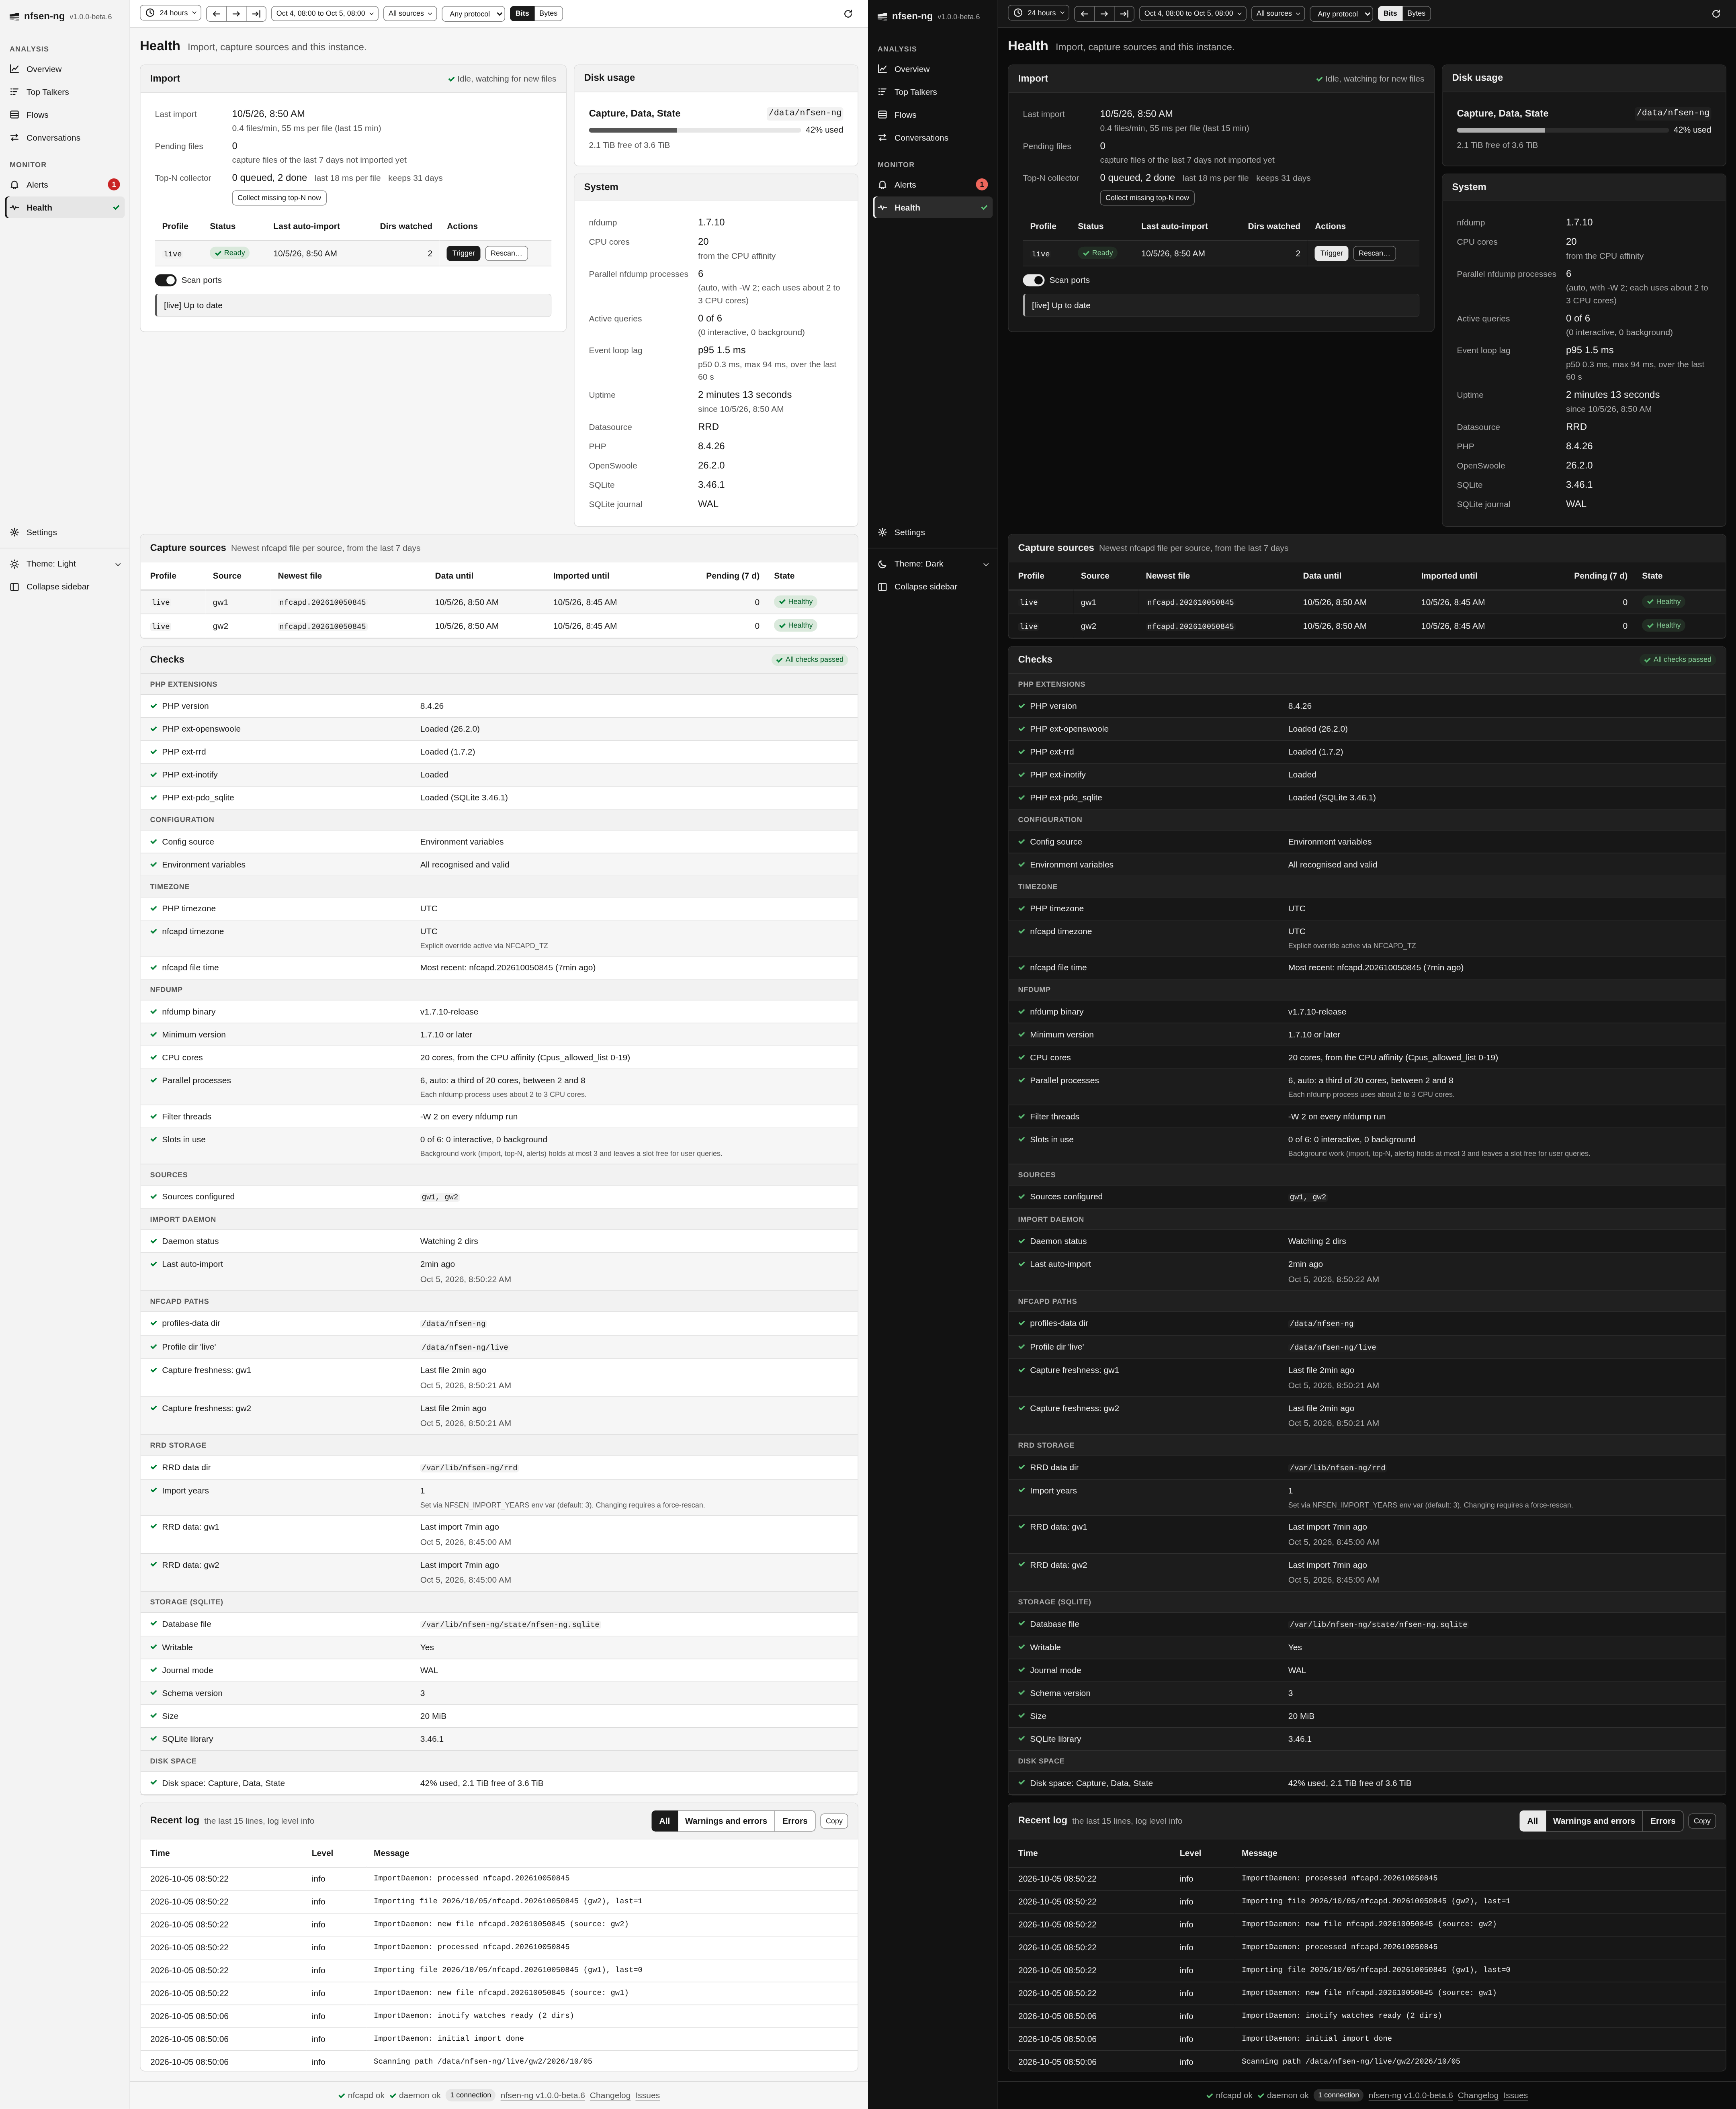
Where the figures come from
| Card | Source |
|---|---|
| Import | ImportStats (rate), HealthMetrics::sources() (pending files), the daemons’ state, TopNCollector::stats() (queued counts the files being collected too), the Import log of the last pass (its newest 100 entries, with the count of all of them) |
| Capture sources | HealthMetrics::sources(): per profile and source, the newest capture file of the last seven days, how far it is imported, and the files of those seven days still waiting (capped at 10,000) |
| Disk usage | HealthMetrics::disks(): disk_free_space() and disk_total_space() of the capture root, the RRD directory and the state directory, merged per filesystem |
| System | nfdump version, the CPU cores and where the count came from (CpuBudget), the parallel nfdump processes with the -W in use, the slots in use by class (NfdumpSlots), the event-loop lag (LoopLag), process start time, PHP, OpenSwoole and SQLite versions, SQLite journal mode |
| Checks | HealthChecker::run() |
| Recent log | Debug::recent(), the last 200 log lines of this worker from an in-memory ring (LogRing), filtered by level in the browser |
ImportStats keeps the last 100 imports of the worker (from the inotify path, the
directory catch-up and a bulk import alike) and reports files per minute and
milliseconds per file over the last 15 minutes. A source is healthy while its
newest file is less than 12 minutes old (2.4 times nfcapd’s five-minute rotation),
stale after that, no data without a file in seven days, and missing without
a directory.
Caching and refresh
The checks and metrics are shared by every tab in one app-wide cache: recomputed
after 30 seconds while some tab has Health open, after five minutes otherwise (for
the sidebar dot). A render never recomputes them. When a part is due, one
coroutine refreshes it, since the checks scan capture directories, and the tabs
that saw the stale cache are re-rendered when it lands. While Health is open,
health-refresh re-renders it every 10 seconds.
Health check groups
| Group | Covers |
|---|---|
| PHP Extensions | PHP version, ext-openswoole, ext-rrd (only required for the RRD datasource), ext-inotify, pdo_sqlite with the SQLite version |
| Configuration | EnvRegistry::issues() (variables set but invalid, deprecated aliases, unknown NFSEN_ names), malformed url/email values, an active (deprecated) settings.php, a saved log level overriding NFSEN_LOG_LEVEL, and a NFSEN_IPINFO_URL/NFSEN_IPINFO_TOKEN pair that can’t work together |
| Timezone | PHP timezone, NFCAPD_TZ validity, and nfcapd file time: the newest file’s name must match the time it was written (mtime minus 300 s, within 30 minutes) and must not lie in the future |
| nfdump | Binary presence; Minimum version, an error below 1.7.2 (the JSON field names changed from 1.6.x) and a warning below 1.7.10; CPU cores with their source; Parallel processes (with auto, how it was derived); Filter threads (the -W passed); Slots in use by class, recounted on every render |
| Sources | At least one configured |
| Import Daemon | Running / initializing / watching N directories, last auto-import age |
| nfcapd Paths | profiles-data reachable; per profile and source, directory presence, flat or nested layout, and capture freshness |
| RRD Storage / VictoriaMetrics | Delegated to the active Datasource::healthChecks() |
| Storage (SQLite) | From Database::inspect(), which opens the file read-only and never migrates: the file and whether it exists, whether it and its directory are writable, the journal mode (WAL, or the rollback journal where the filesystem refused WAL), the schema version, the size, and the SQLite library (3.33 or later, which the top-N rollups need for UPDATE ... FROM) |
| Disk space | One row per filesystem of the Disk usage card: warning from 85 % used, error from 95 % |
Every entry is ok, warning or error, sorted errors first within its group,
with an optional hint that says what to do about it. The MCP status tool returns
the same checks, the SQLite group included.
The Minimum version warning explains itself by version. Below 1.7.9 its hint names the security fixes of 1.7.9 (the NetFlow v9, IPFIX and sFlow collectors and the reading of malformed capture files); for 1.7.8 and 1.7.9 it adds that gcc builds list the two directions of a flow as separate rows in Bi-directional results. Both end with Upgrade to nfdump 1.7.10.
nfdump processes
NFSEN_NFDUMP_MAX_PROCESSES bounds how many nfdump processes run at once
(auto: a third of the CPU cores, 2 to 8), and NFSEN_NFDUMP_WORKERS sets the
-W of every run. The System card shows the cores (from the CPU affinity, the
container’s CPU limit or the online CPU count), Parallel nfdump processes
(auto, with -W 2; each uses about 2 to 3 CPU cores) and Active queries, the
slots in use against the limit, split into interactive, background and waiting
callers. The nfdump checks list the same with the details: the file the core
count came from, how auto derived the limit or that a variable or settings.php
set it, and the rule background work follows. The limit counts the processes
nfsen-ng started (the import daemon’s and the top-N collector’s included). See
Nfdump Integration
and nfdump processes and CPU cores.
Event loop lag
Every tab of the instance is served by one worker’s event loop, and whatever holds
it (a render, a synchronous file scan, an SQLite write) delays every action, live
update and timer by as long. LoopLag measures that: a timer due every 100 ms
records how late it fired, and a longer stall counts as every tick it swallowed.
The System card’s Event loop lag row shows the p95, the p50 and the maximum
over the last 60 seconds (p95 1.4 ms, p50 0.3 ms, max 9.1 ms, over the last 60
s), and not measured yet right after a start. From a p95 that reads 100 ms the
row carries the warning glyph and screen readers hear Slow:; from 1.0 s the
error glyph and Stalled:. AppStartup starts the probe and stops it on
shutdown.
Import controls
Trigger (trigger-import) re-runs the catch-up scan for one profile.
Backfill (backfill-import, VictoriaMetrics) re-reads every capture file,
including those behind the newest stored sample, and writes each to its slot.
Rescan (force-rescan, RRD) resets the profile’s datasource first, a
destructive re-import behind a confirmation dialog. All three lock the profile’s
ImportDaemon for their duration, so the ongoing inotify poll does not advance
the datasource past where the manual pass has reached, and cancel-import stops
them. Progress ticks are broadcast on the admin:import scope, which also drives
the import chip in the controls bar.
Collect missing top-N now (topn-fill) runs TopNCollector::fillAllGaps() at
once: one newest-first pass over every profile and source of the retention window
that queues up to 500 capture files without a usable interval, and further passes
follow until nothing is missing or a file fails. The collector’s own gap filler
does the same every ten minutes while its queue is empty.