Alerts
Threshold rules, evaluated automatically for every five-minute interval as the
import brings it in, on their own Alerts page. Managed by AlertManager
(backend/common/AlertManager.php), with the page in AlertsPage.php and the
actions in AlertActions.php.
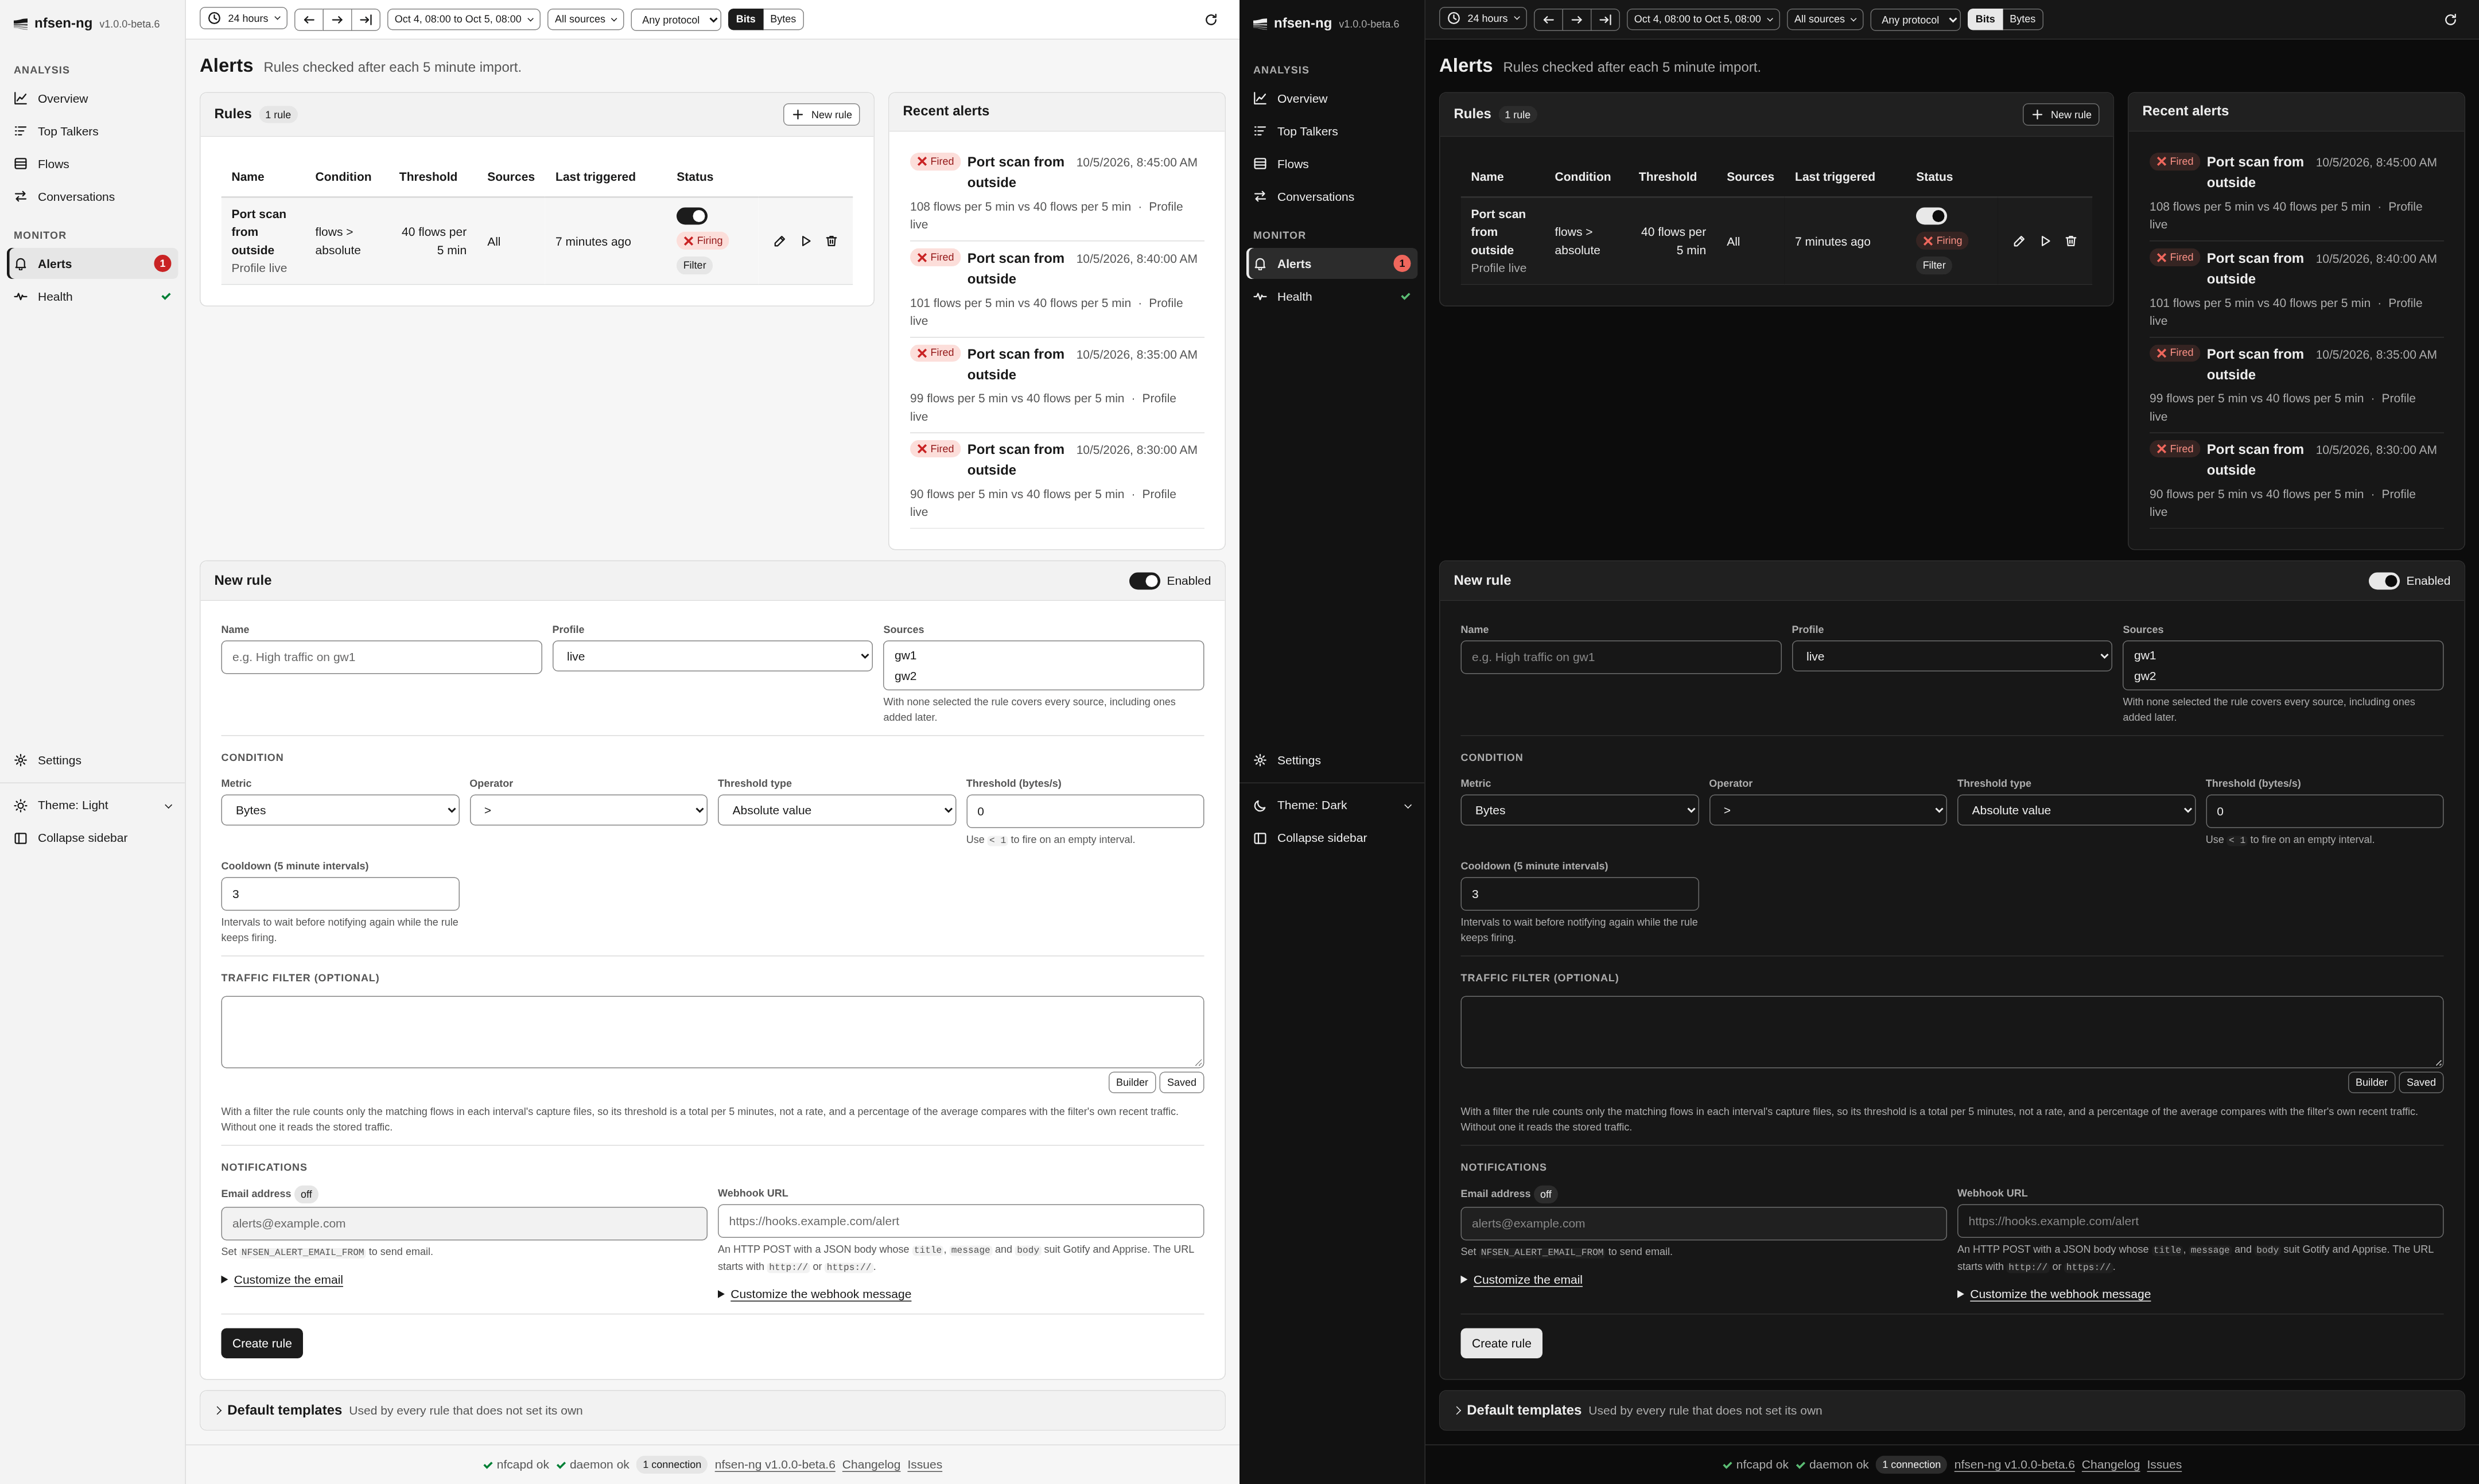
Rule shape
| Field | Notes |
|---|---|
| Profile, sources | The nfdump profile, and the sources to sum; none means every configured source, including ones added later |
| Metric | flows / packets / bytes |
| Operator | >, >=, <, <= |
| Threshold type | Absolute value, or percent of a rolling average over a window (10 min to 24 h); see Baseline |
| Cooldown | Five-minute intervals to wait before notifying again while the rule keeps firing |
| Traffic filter | Optional raw nfdump filter expression |
| Notifications | Email and/or webhook (HTTP POST, JSON payload; see libcurl 8.20 and OpenSwoole) |
Rules stay in preferences.json and their runtime state in alerts-state.json:
whether the rule is firing, the remaining cooldown, and the last interval
evaluated. A percent-of-average rule without a baseline is not evaluated for
that interval, and the log says why.
Evaluation per interval
The import daemon calls AlertManager::onFileImported() after each capture file.
Every enabled rule of the profile is evaluated once per interval, when every
configured source has reported that interval or a newer one, whatever the arrival
order. A source that has nothing waiting on disk once a later interval is in
counts as down and is left out until it reports again, so one dead exporter does
not hold back the others. A slot more than two hours behind the newest file
(CATCH_UP_SECONDS, room for the catch-up of a new day directory) stops waiting
for a source that is still importing. The slot is the interval’s start, and
{time} in a notification is that start, in UTC, for Test as well.
- Without a traffic filter, a rule reads each source’s stored value for the
interval right after that source’s import (
fetchLatestSlot()of the datasource) and sums the sources, so the value is the stored rate. - With a traffic filter, it runs one
nfdump -s proto -n 0 -o csvover the interval’s capture files of its sources, with the filter, and adds up the flows, packets and bytes of the protocol rows (AlertManager::sumProtocolRows()). nfdump does the summing, so a busy interval costs the worker no more memory than a quiet one; packets and bytes count the input direction, as nfdump’s per-protocol statistic prints them. The value is a total per five minutes, not a rate, and the form says so. This is what lets a rule watch “ICMP only” or “this one subnet”.
The live evaluation runs its nfdump calls as background work (see
Nfdump Integration):
the import daemon waits for it, so one evaluation waits at most 60 seconds in
total (LIVE_SLOT_BUDGET_SECONDS) for the processes of all its filtered rules. A
rule still without one is left out of that interval with no free nfdump process in the log. Each check runs its own Nfdump instance.
A value that cannot be read (a failed nfdump run, an nfdump output without a
per-protocol statistic, a datasource that does not answer, no baseline yet)
leaves that interval of that rule unevaluated with the reason in the log, rather
than counting it as zero. The rule form validates the
filter with nfdump -Z and refuses to save one nfdump rejects.
fetchCurrentSlot() and testRule() use the same slot and sources as the live
evaluation, so testing a rule and evaluating it behave identically.
Baseline of percent-of-average rules
A percent-of-average rule compares the checked interval with its average over
the window before that interval (AlertManager::baseline()), in the unit of the
value:
- Without a filter, the average comes from the datasource,
fetchRollingAverage($sources, $profile, $window, $slot): per second on RRD, per 5 minutes on VictoriaMetrics, over the window that ends where the checked interval starts. The value is each source’s stored interval,fetchLatestSlot(), which leaves out a source more than one interval behind the newest. - With a filter, the stored series cannot say how much of the traffic the
filter matched, so the rule averages its own values. The live evaluation of an
enabled rule records each checked interval’s total in
alert_samples(AlertSampleRepository), keyed by rule and interval, with a fingerprint of its profile, sources, filter and metric. The baseline is the mean of the samples with the current fingerprint in the window before the checked interval. An empty or failed read records nothing; an interval that matched nothing records 0. Test only reads.
There is no baseline until one earlier interval is recorded, and none while the
average is zero, for either kind. So a filtered rule on traffic that is normally
absent (proto icmp on a quiet link) cannot fire on a burst of it, and a firing
below x % rule stays firing while its filter matches nothing, since those
intervals are not evaluated.
At each check, the profile’s rules drop the samples more than 24 hours older than
the checked interval. An interval checked late keeps the samples after it; those
go only when the clock or NFCAPD_TZ moved back (the rule holds a sample more
than an hour ahead of now and the checked interval is not). Changing a rule’s
profile, sources, filter or metric starts its baseline over from the next import
or check, and deleting a rule drops its samples and its Test events.
Events that filtered percent-of-average rules recorded before the samples existed (schema version 3) keep their threshold, which was a per-second average of all traffic; the history now labels it as a total per 5 minutes.
Fired and resolved
When the condition holds, a rule that was not firing fires: an event is recorded and, unless the cooldown is still running, the notifications go out. While it keeps firing, it notifies again each time the cooldown has run out. When a firing rule finds the condition false on a later interval, it is resolved: that is recorded as an event, and nobody is notified.
Events live in SQLite (alert_events, see SQLite store),
written by AlertEventRepository: fired, resolved and test, with the rule,
profile, sources, metric, operator, value and threshold. The page shows the last
50, newest first, and the rules table reads each rule’s last fired event from
them. Last triggered is an sb-relative-time element (vendored from Starbase):
the server renders the label (12 minutes ago), and the element keeps it
counting while the page is open (now, 30 seconds ago, yesterday, last
week). On hover it shows the date and time with seconds, in the display
timezone: its time-zone attribute is the capture timezone when Settings say so,
and empty (the browser’s) otherwise. The sidebar counts the firing rules (AlertManager::firingCount()). When
the store is unavailable, the history says History unavailable with the reason,
and evaluation and notifications go on.
On the first start after the upgrade, AlertManager::migrateLegacyLog() moves
every entry of the old alerts-log.json into the table as a fired event with
origin migrated, in one transaction that also sets the meta key
migrated.alerts_log, and renames the file to alerts-log.json.migrated. If it
fails, the next start tries again.
Test
test-alert?id= evaluates the rule against the newest complete interval, with
the sources the live evaluation would use, records a test event, and sends the
notifications only when the condition holds. It never touches the rule’s state,
cooldown or samples. The result opens as a dialog rendered into the shell’s modal
root, so live updates do not close it. The dialog shows would fire or would not,
the value and threshold or the reason there are none, the interval, the four
rendered templates, and one line per channel (TestResult['delivery']):
- Sent (the email names its address), when the webhook answered 2xx or
mail()accepted the email; - Failed and why: the webhook’s status or error, or the mail error;
- Not configured, or Not configured on this server for an email while
NFSEN_ALERT_EMAIL_FROMis not set; - Not sent, because the rule would not fire or could not be evaluated.
Test waits up to 10 seconds for the webhook’s answer. A live notification does not wait: it posts from its own coroutine and logs a failed webhook. The reasons name the average window as the form does (the 1 h average).
Actions
| Action | Input | Does |
|---|---|---|
save-alert | the alert_form_* signals | Create or update a rule (by id) |
delete-alert | ?id= | Remove a rule and its state |
toggle-alert | ?id=&enabled=true|false | Switch a rule on or off; without enabled it flips |
test-alert | ?id= | The Test dialog above |
save-alert-templates | the four settings_default*Template signals | Save the global default templates |
Notification templates
Email subject/body and webhook title/message are built from {token} templates.
Resolution is a three-tier fallback in AlertManager::resolveTemplate():
- The rule’s own override (
AlertRule::$emailSubjectTemplate,$emailBodyTemplate,$webhookTitleTemplate,$webhookMessageTemplate; nullable,null= unset, the same convention as$nfdumpFilter). - A global default, stored in
UserPreferences/Settings($defaultEmailSubjectTemplateetc.; plainstring,''= unset) and saved bysave-alert-templates.save-settingsdoes not touch them. AlertManager’s built-inDEFAULT_EMAIL_SUBJECT,DEFAULT_EMAIL_BODY,DEFAULT_WEBHOOK_TITLEandDEFAULT_WEBHOOK_MESSAGEconstants, themselves{token}templates. A golden test inAlertManagerTest.phpasserts that the rendered output for a rule without overrides matches the text these produce.
AlertManager::buildTemplateVars() builds the substitution map (12 tokens; see
the user guide for the
list); substitution is a plain strtr(). {flows}, {packets} and {bytes} are
always all three populated, whatever the rule’s own metric, since one read
returns all three. {sources} lists the configured sources for a rule without a
selection.
The live preview (frontend/js/components/alert-template-preview.js) mirrors this
resolve and substitute logic in the browser with example numbers, so it works for
a new, unsaved rule without a server round trip. The preview <pre> elements
carry data-ignore-morph, like the series and legend lists of the traffic graph
in shell/traffic-graph.html.twig:
they are empty in the server-rendered HTML and filled by data-effect, so without
it the next SSE morph would reconcile them back to the server’s empty version and
wipe the preview.