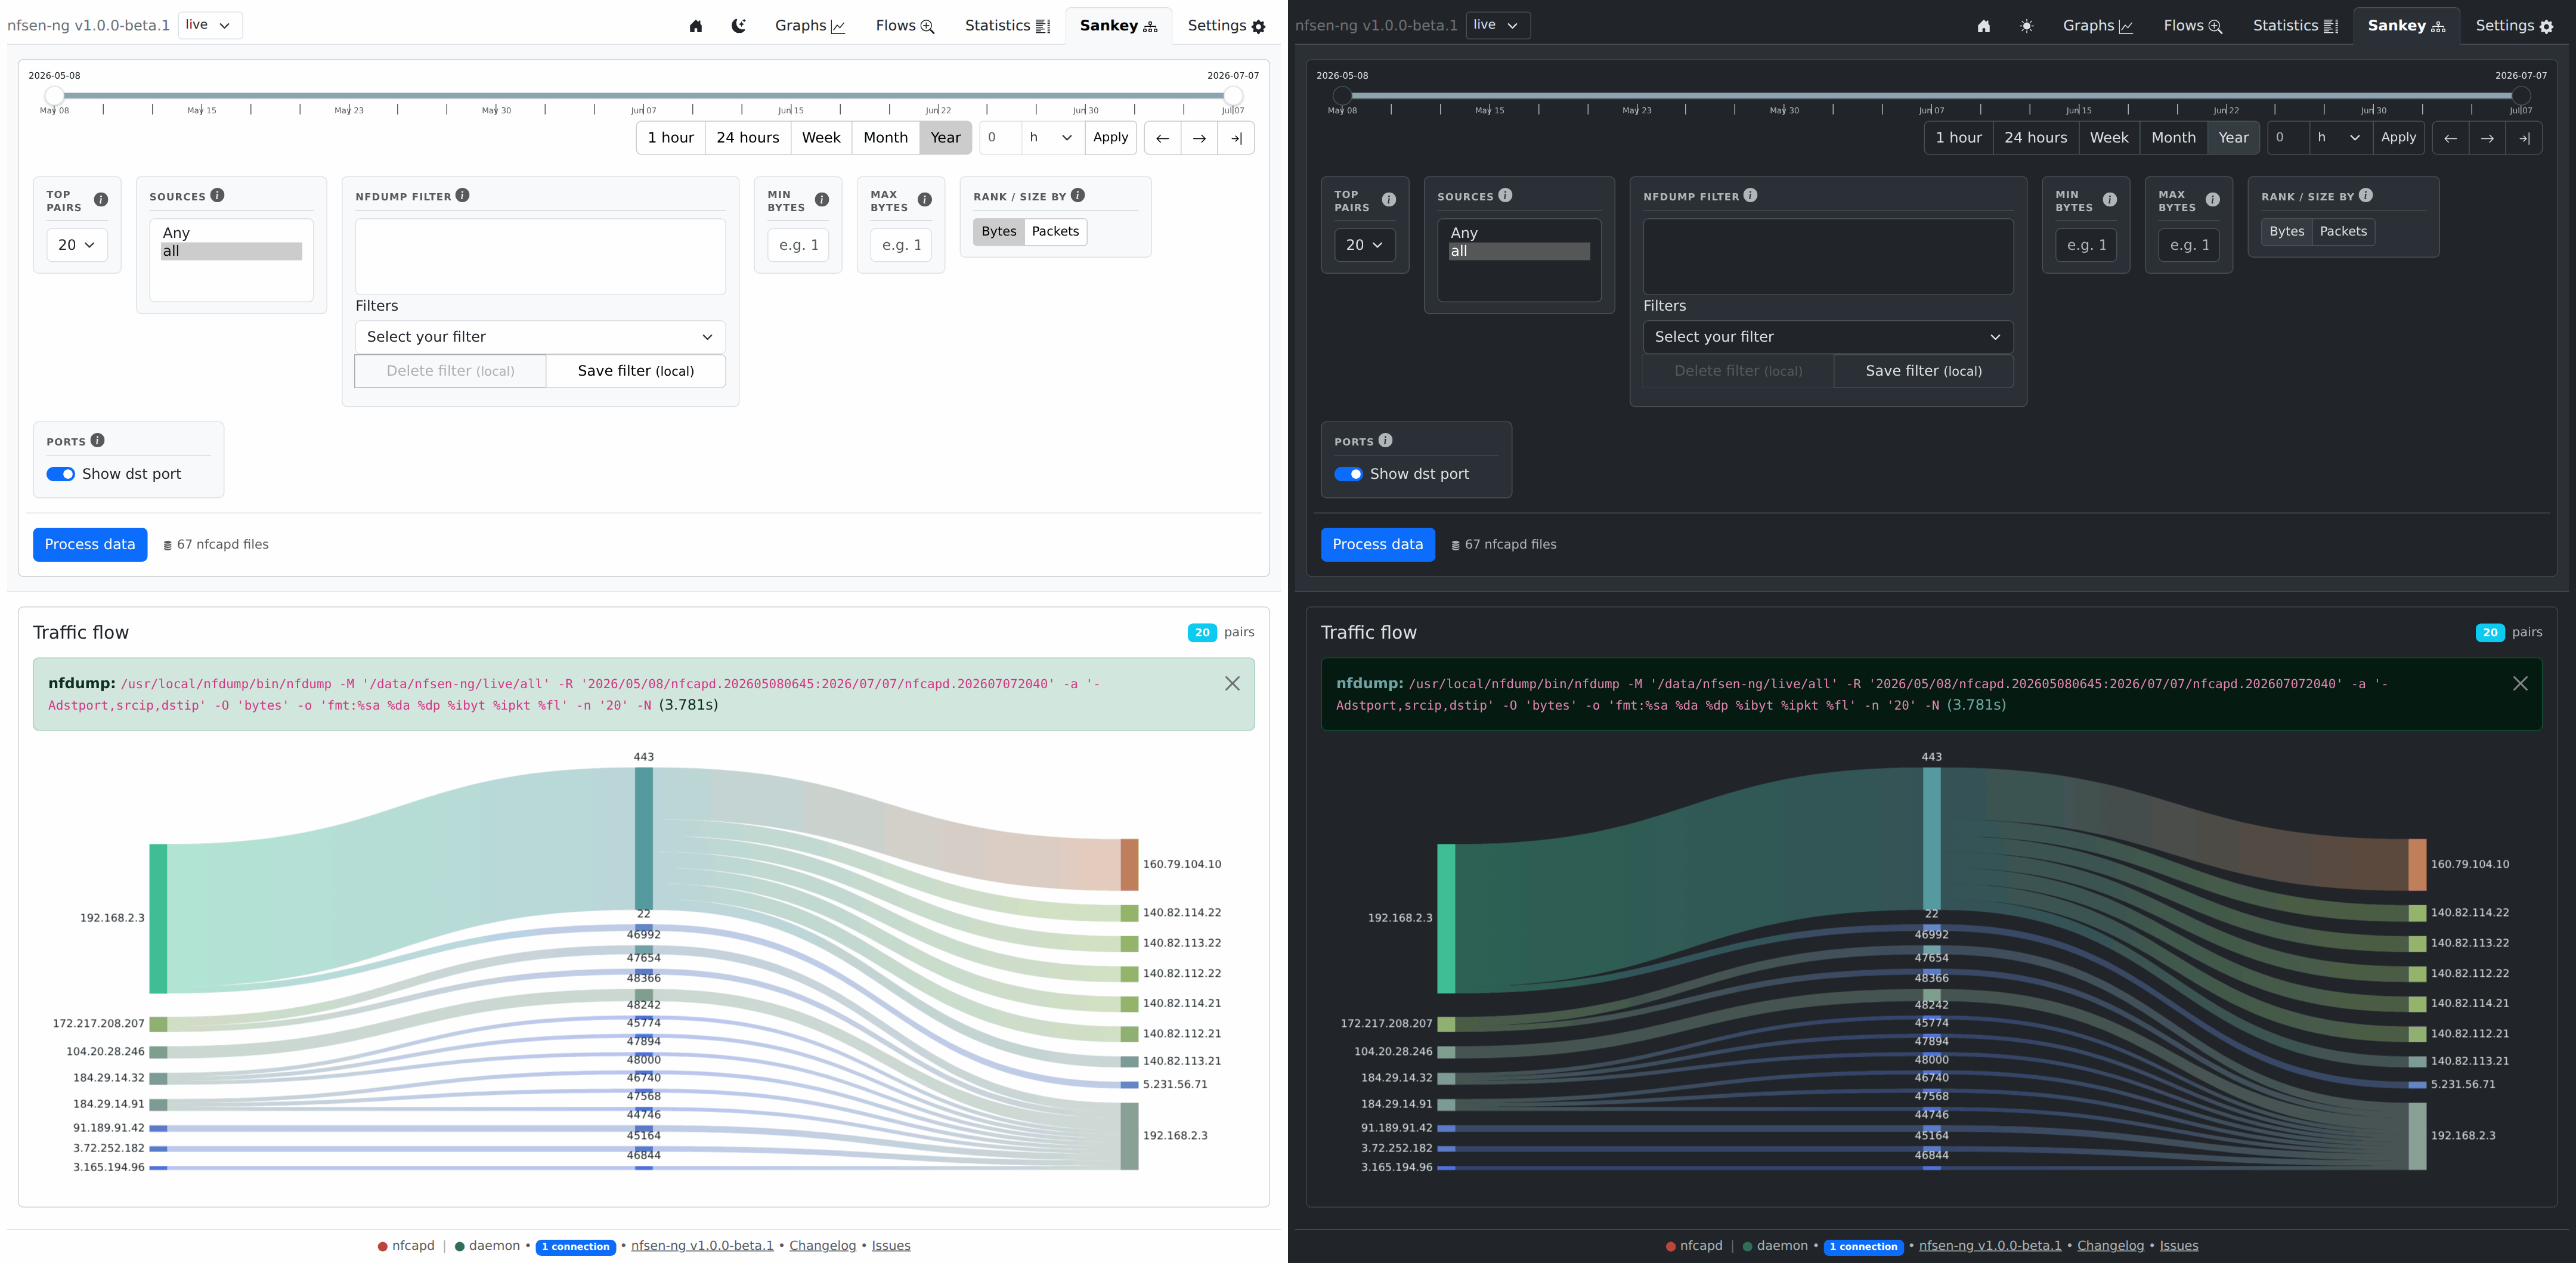
Sankey Diagram
A flow-volume Sankey diagram (source → destination, ranked by bytes or
packets) rendered with ECharts, backed by a
new nfdump aggregation query (SankeyActions.php) rather than reusing the
Flows/Statistics query shapes.
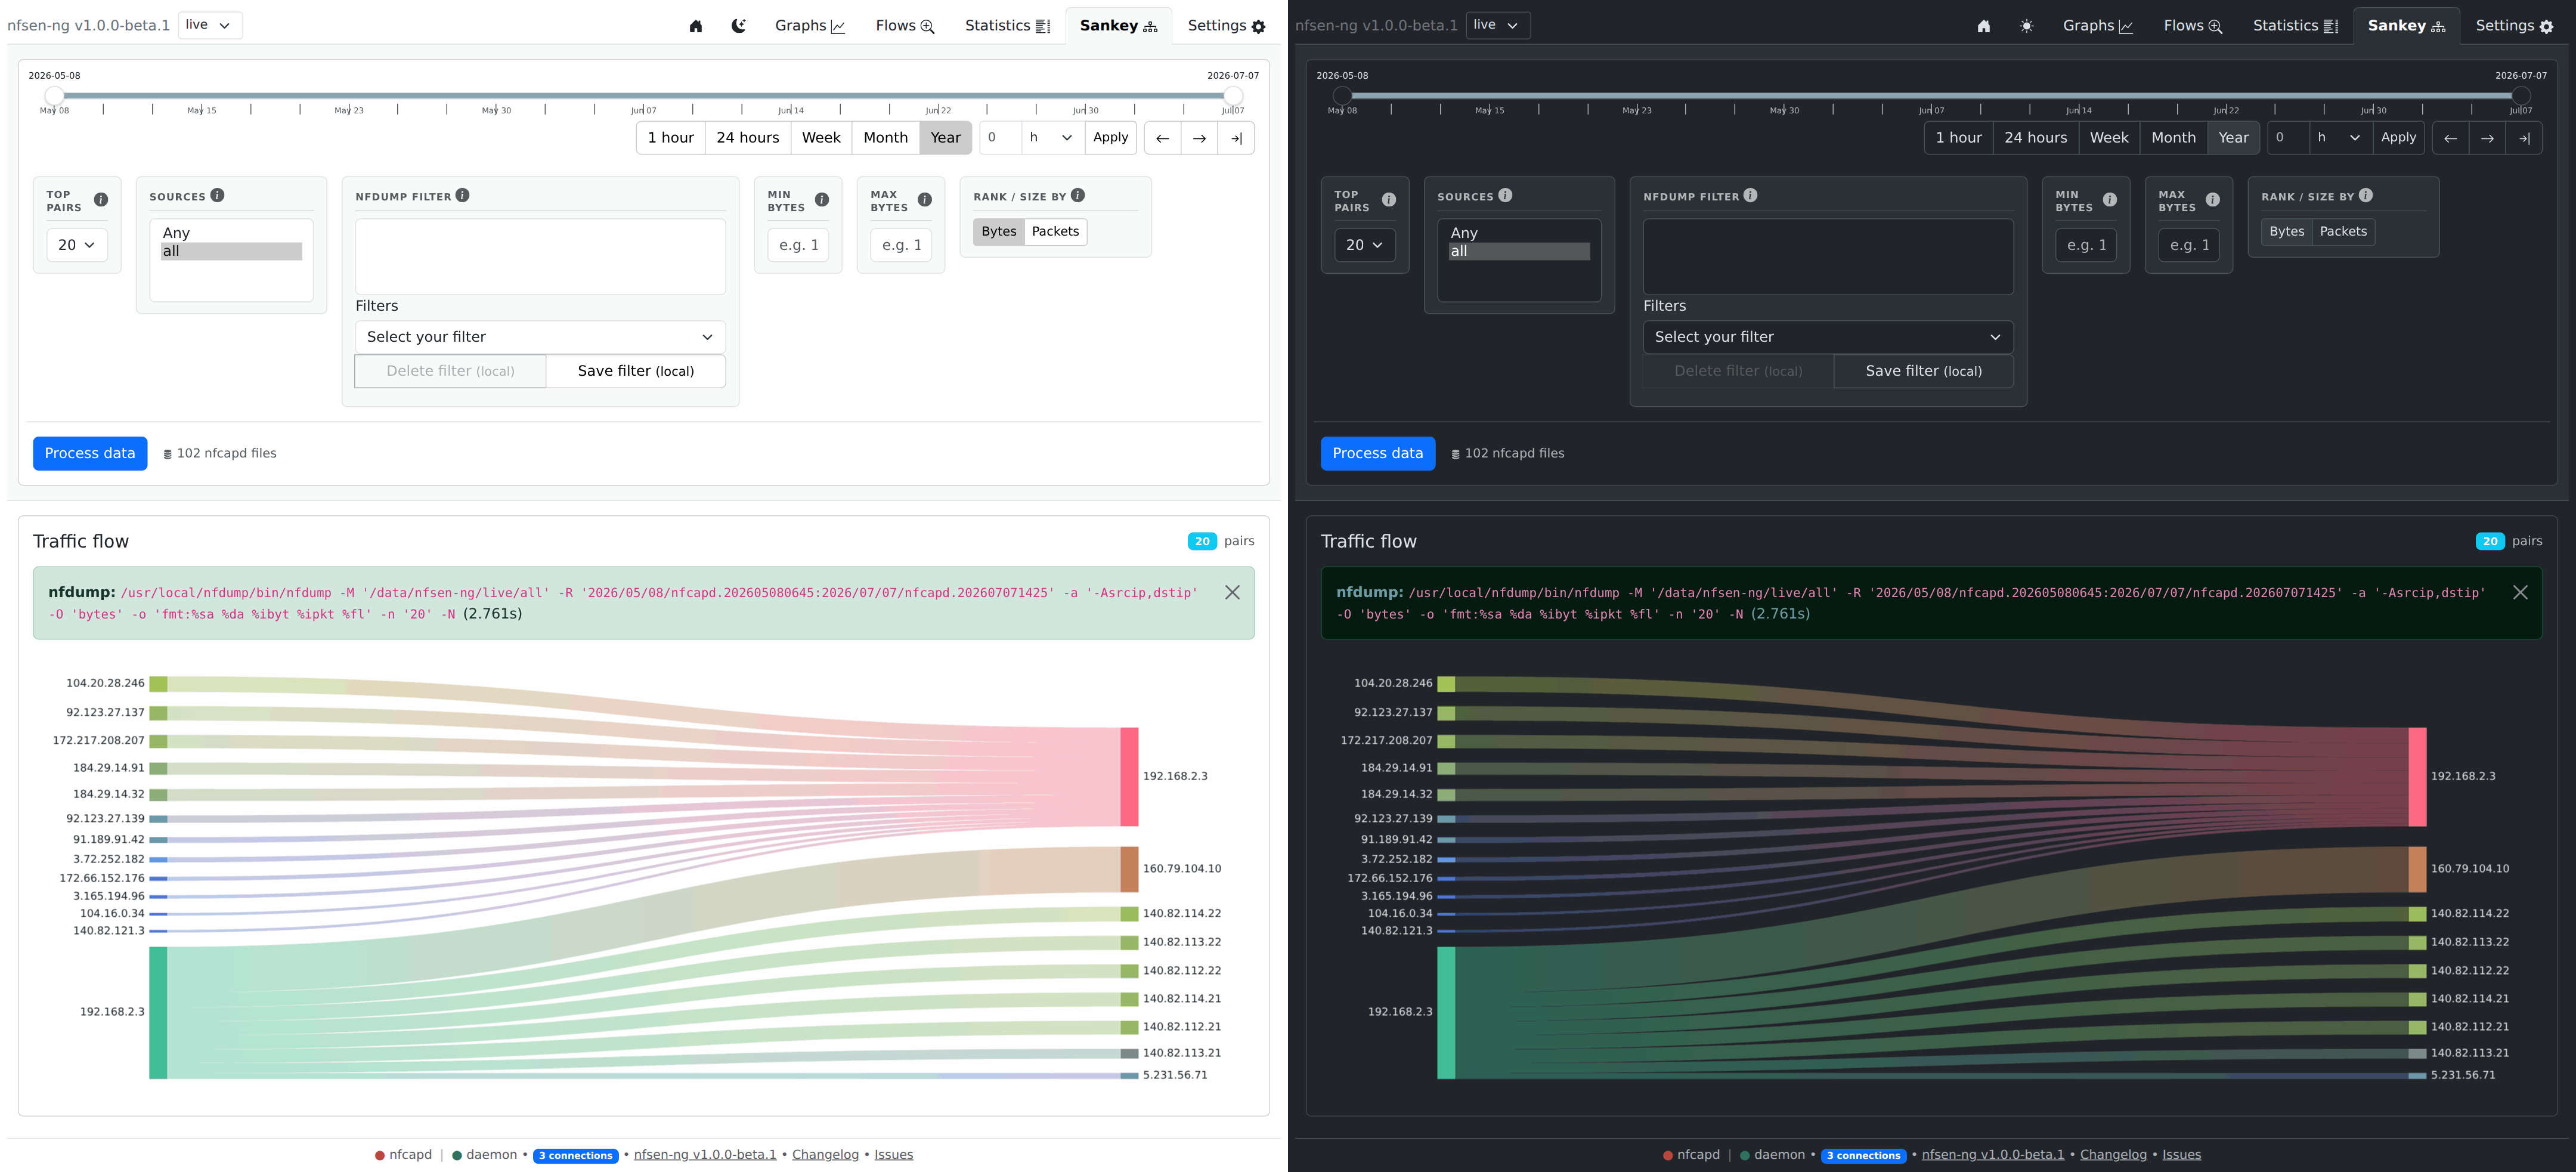
Filters
Same shape as Statistics — date range, sources, nfdump filter, min/max bytes — plus:
| Control | Effect |
|---|---|
| Top pairs | How many src→dst pairs to render |
| Rank / size by | Bytes or packets |
| Ports | Add the destination L4 port as a middle column (src IP → dst port → dst IP) |
With Ports on, the aggregation key gains the destination port
(-A srcip,dstport,dstip) and the payload becomes three columns: the middle
port: nodes carry a per-port total, so all traffic src→port and port→dst is
summed into shared ribbons.