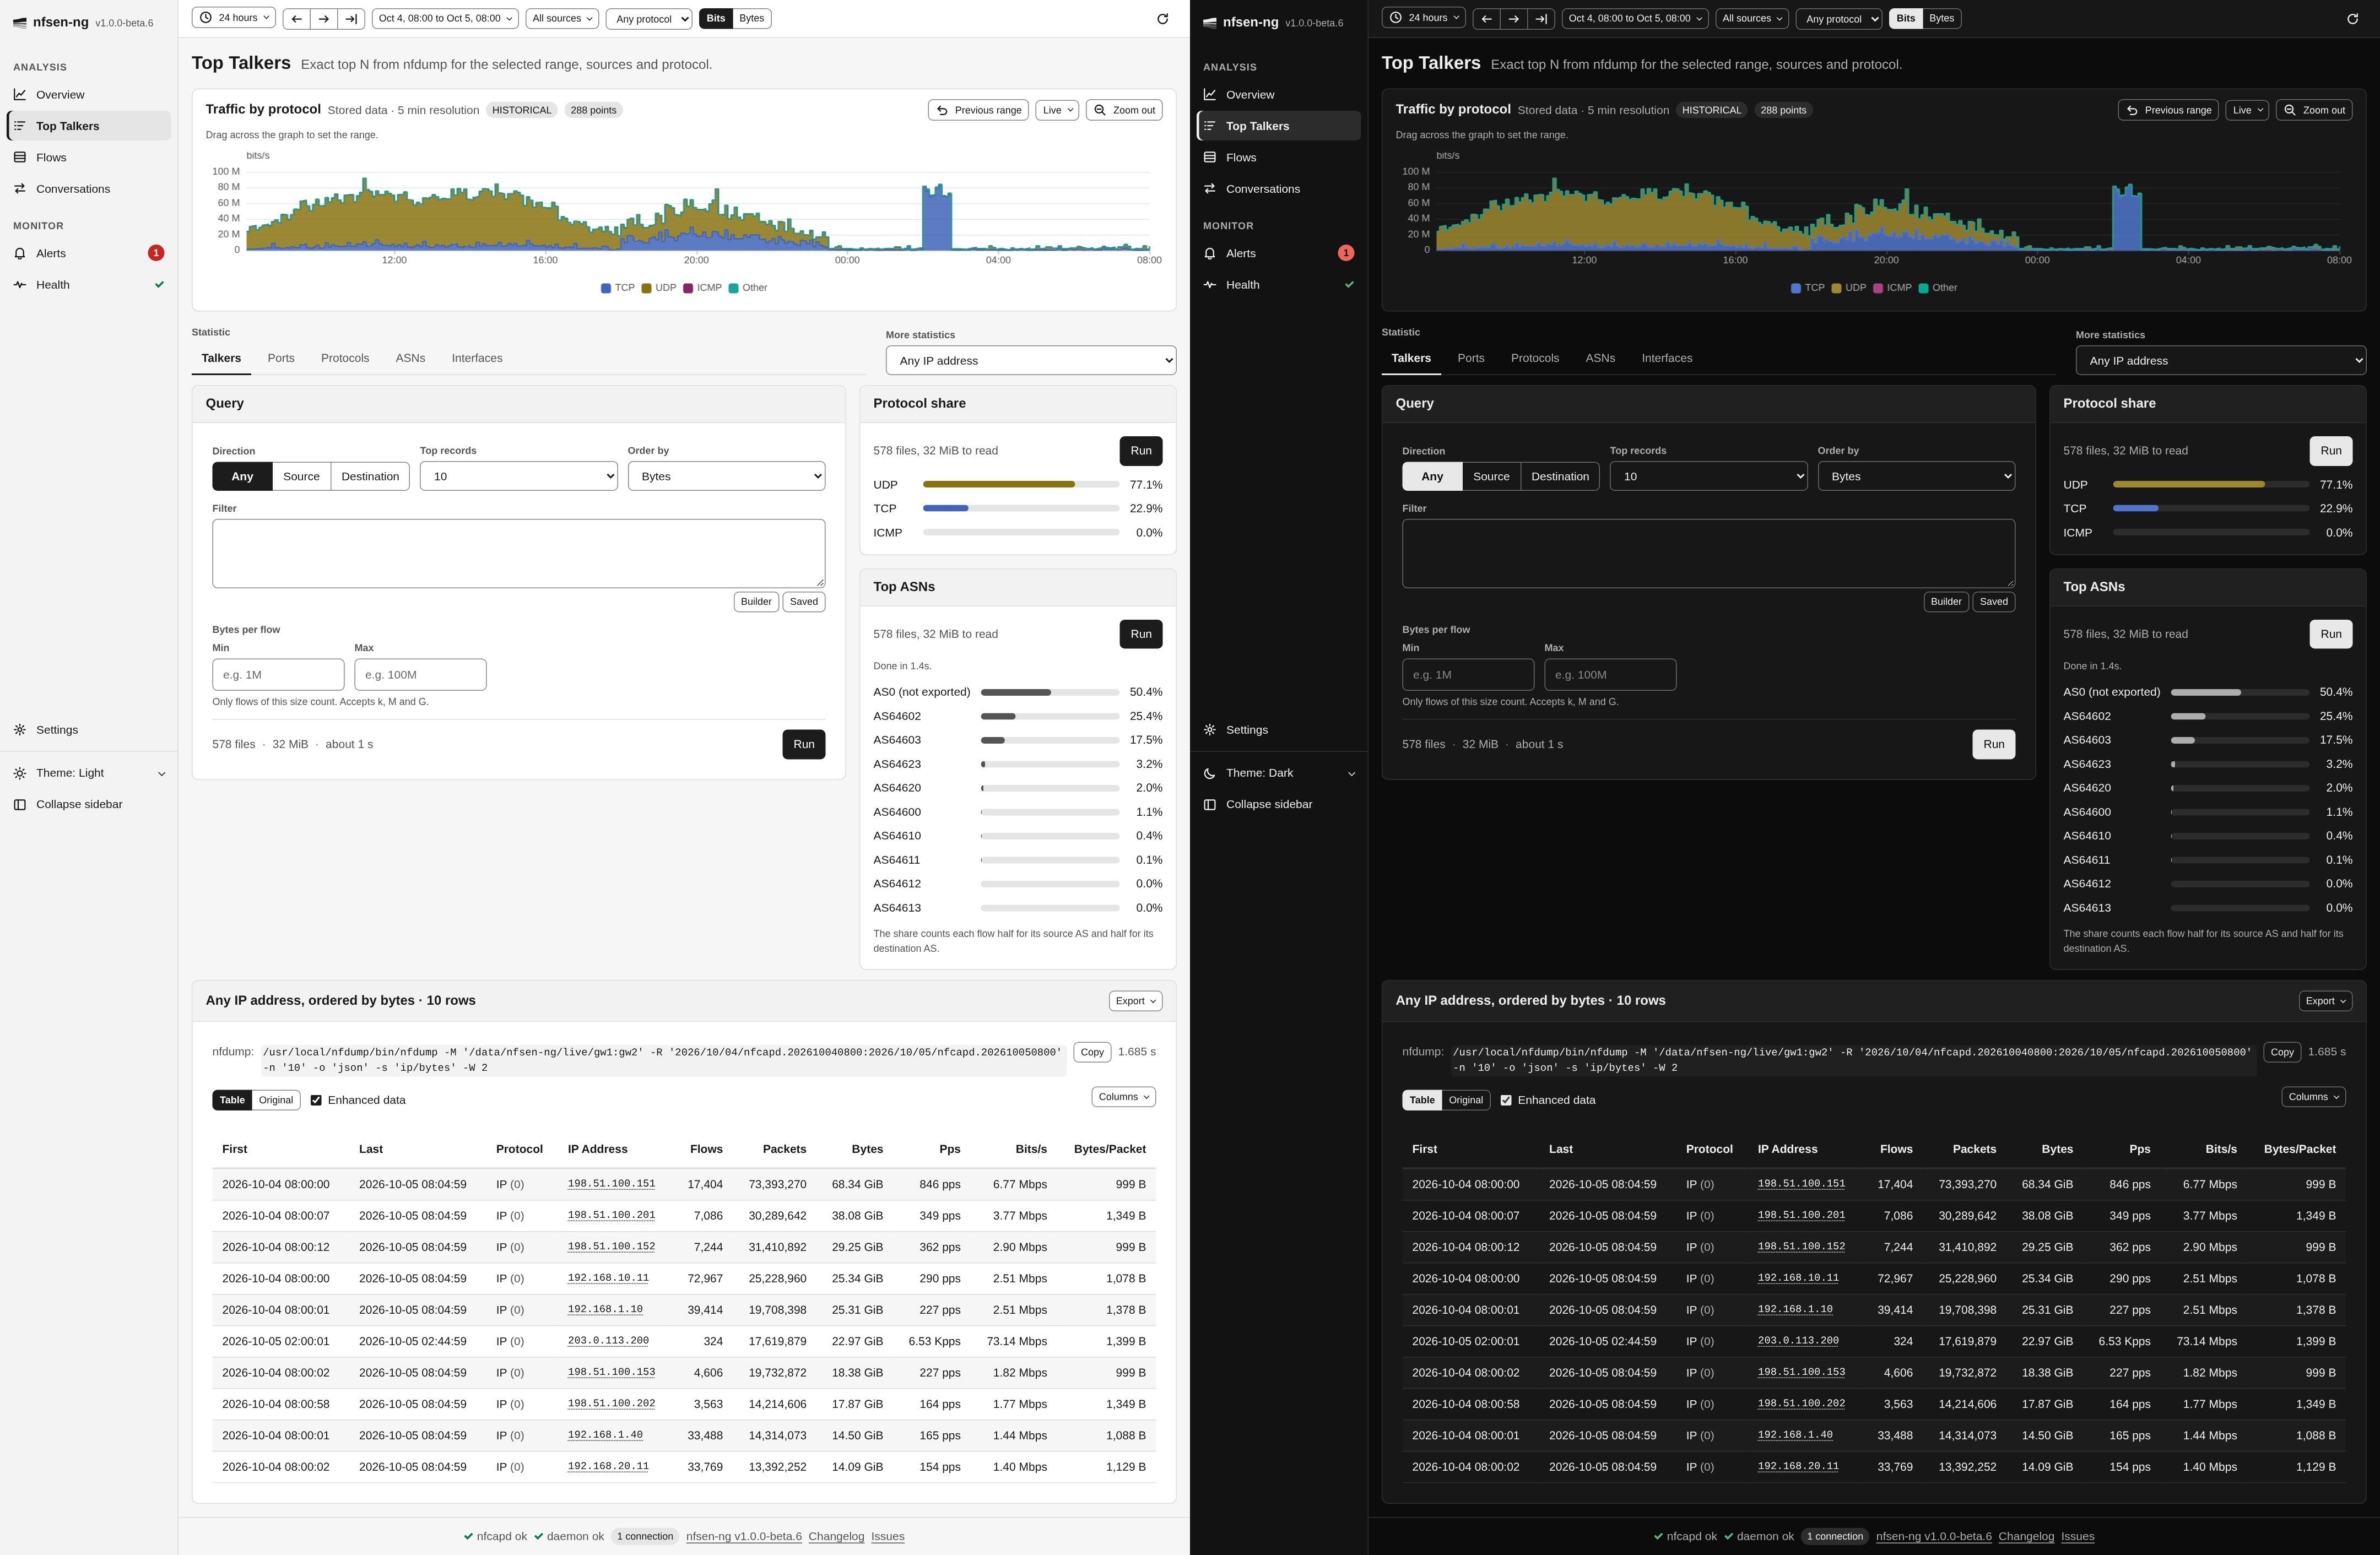
Top Talkers
Top-N breakdowns with nfdump’s -s statistics mode, over any element nfdump
supports, plus two side panels for the protocol split and the busiest autonomous
systems. Page: TalkersPage (backend/pages/TalkersPage.php), actions in
StatsActions.php, per-tab state in TalkersState.
The statistic catalog
StatisticCatalog (backend/query/StatisticCatalog.php) is the one list of the
58 statistic elements the page offers, each with its label and its group in the
More statistics select. It also defines:
TABS: the five common statistics as families with a direction (talkersisip,srcipordstip;portsisport,srcportordstport;protocolsisprotoonly;asnsandinterfaceslikewise). The page’sstats_dirsignal (any,src,dst) picks the member.FAMILIES: the same pairing for ToS, masks, VLAN and the NAT address and port elements, so the Direction control works for them too.ORDER_BY:flows,packets,bytes,pps,bps,bpp.stats_orderByis checked against it before it reaches-s <element>/<order>, asstats_foris checked against the catalog.unsupported(): the NEL elements (nevent,nsrcip,ndstip,nsrcport,ndstport) probed once per nfdump binary withnfdump -Z '' -s <element>/bytes. nfdump 1.7.10 exits 1 with Unknown statistic, and the select shows those options disabled with that reason.TalkersPagecaches the answer for 60 seconds per binary.
Choosing a statistic changes signals only. talkers-select re-renders so a
statistic that ran earlier in this tab shows its stored result; nothing runs.
Running a statistic
stats-actions (query kind stats) builds a StatsQuery
(backend/query/StatsQuery.php): -M with the global sources, -R for the
window, -n for Top records, -s <element>/<order>, the byte limits and the
global protocol composed into the filter by FilterComposer, and the window
clamped by NFSEN_MAX_STATS_WINDOW. It runs through QueryRunner with progress
and Kill, and its estimate is estimate-query?target=talkers. The
server-owned _stats_rows signal carries the row count of the stored result,
shown as “N rows returned” when the run finishes.
StatsQuery::runPartitioned() splits a large read into time slices that run as
parallel nfdump processes and merges them exactly (see
Statistics in parallel).
StatsQuery::splittable() decides whether a statistic can be split at all: only
rankings by flows, packets or bytes, and Flow Records only with an -A
aggregation. The estimate counts a split only for a statistic that can take one,
the progress counts files across the parts, and the final status names the
processes the result came from. The side panels split the same way.
The result is stored per statistic in TalkersState, with a fingerprint of its
inputs. The window part of the fingerprint is live:<width> while the range is
live, so a live result does not turn stale by itself; after five minutes the card
says which span it covers instead. The table is sent once through a result host
(see Reactive Loop). Clamp
notices and nfdump’s stderr lines are kept with the result they belong to, and a
cancelled run keeps the statistic’s earlier result.
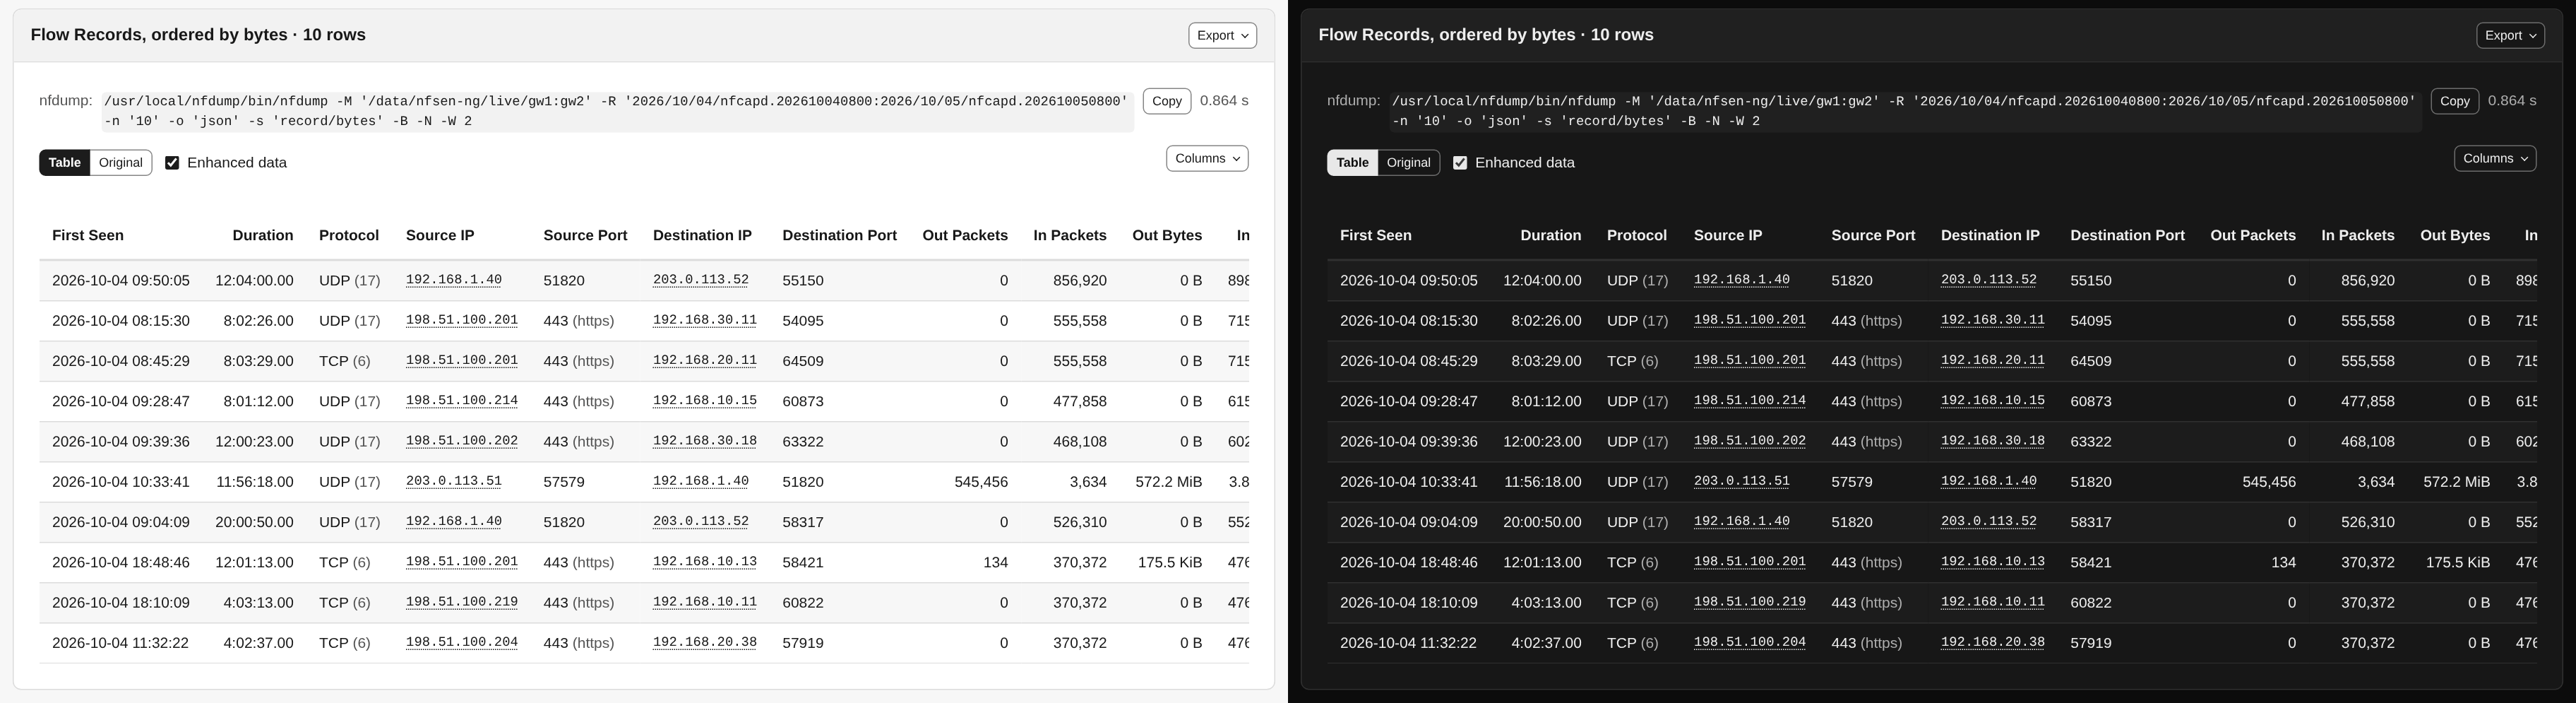
Each row links its IP-shaped values to the IP info lookup. The
table is nfsen-table with sorting, the Columns menu, CSV/JSON/Print export and
the Enhanced data switch, as on Flows.
Side panels
talkers-panel?panel=proto|as (query kind talkers-panel) runs -o csv -n 10 -s proto/bytes or -s as/bytes with the query card’s filter, byte limits,
window, sources and protocol. MultiStatCsvParser reads the csv, and the panel
stores its bars with the inputs they were computed for, so it can say when the
query card has moved on.
- Protocol share colours its bars with the protocol series slots of the traffic graph (TCP 1, UDP 2, ICMP 3, Other 4).
- Top ASNs comes from nfdump’s
asstatistic, which counts a flow for both of its ends. The bar length halves that (each flow counts half for its source AS and half for its destination AS) so the shares add up; the hover shows nfdump’s byte figure for the AS.
Aggregation
Flow Records ranks whole flows rather than one element of them, so what counts
as one flow is a question only the user can answer. The aggregation controls
are the same partial the Flows page uses (bidirectional, protocol,
source and destination port, per-direction IP with an optional prefix length),
mapping onto nfdump’s -A, or -B for bidirectional.
They appear for Flow Records only, because nfdump applies an aggregation to
that statistic alone and answers every other one with Warning: Aggregation ignored for element statistics. nfdump chooses the column set: aggregating by
destination port yields a table of ports, not of 5-tuples.

Bi-directional is the one query whose output format nfdump chooses for itself:
it prints its merged-flow table as fixed-width text whatever -o it is given.
nfsen-ng reads that table back into columns, so it behaves like any other result
(IP lookups, formatted byte counts, CSV/JSON export), with nfdump’s text one click
away under Original.