Traffic Graphs
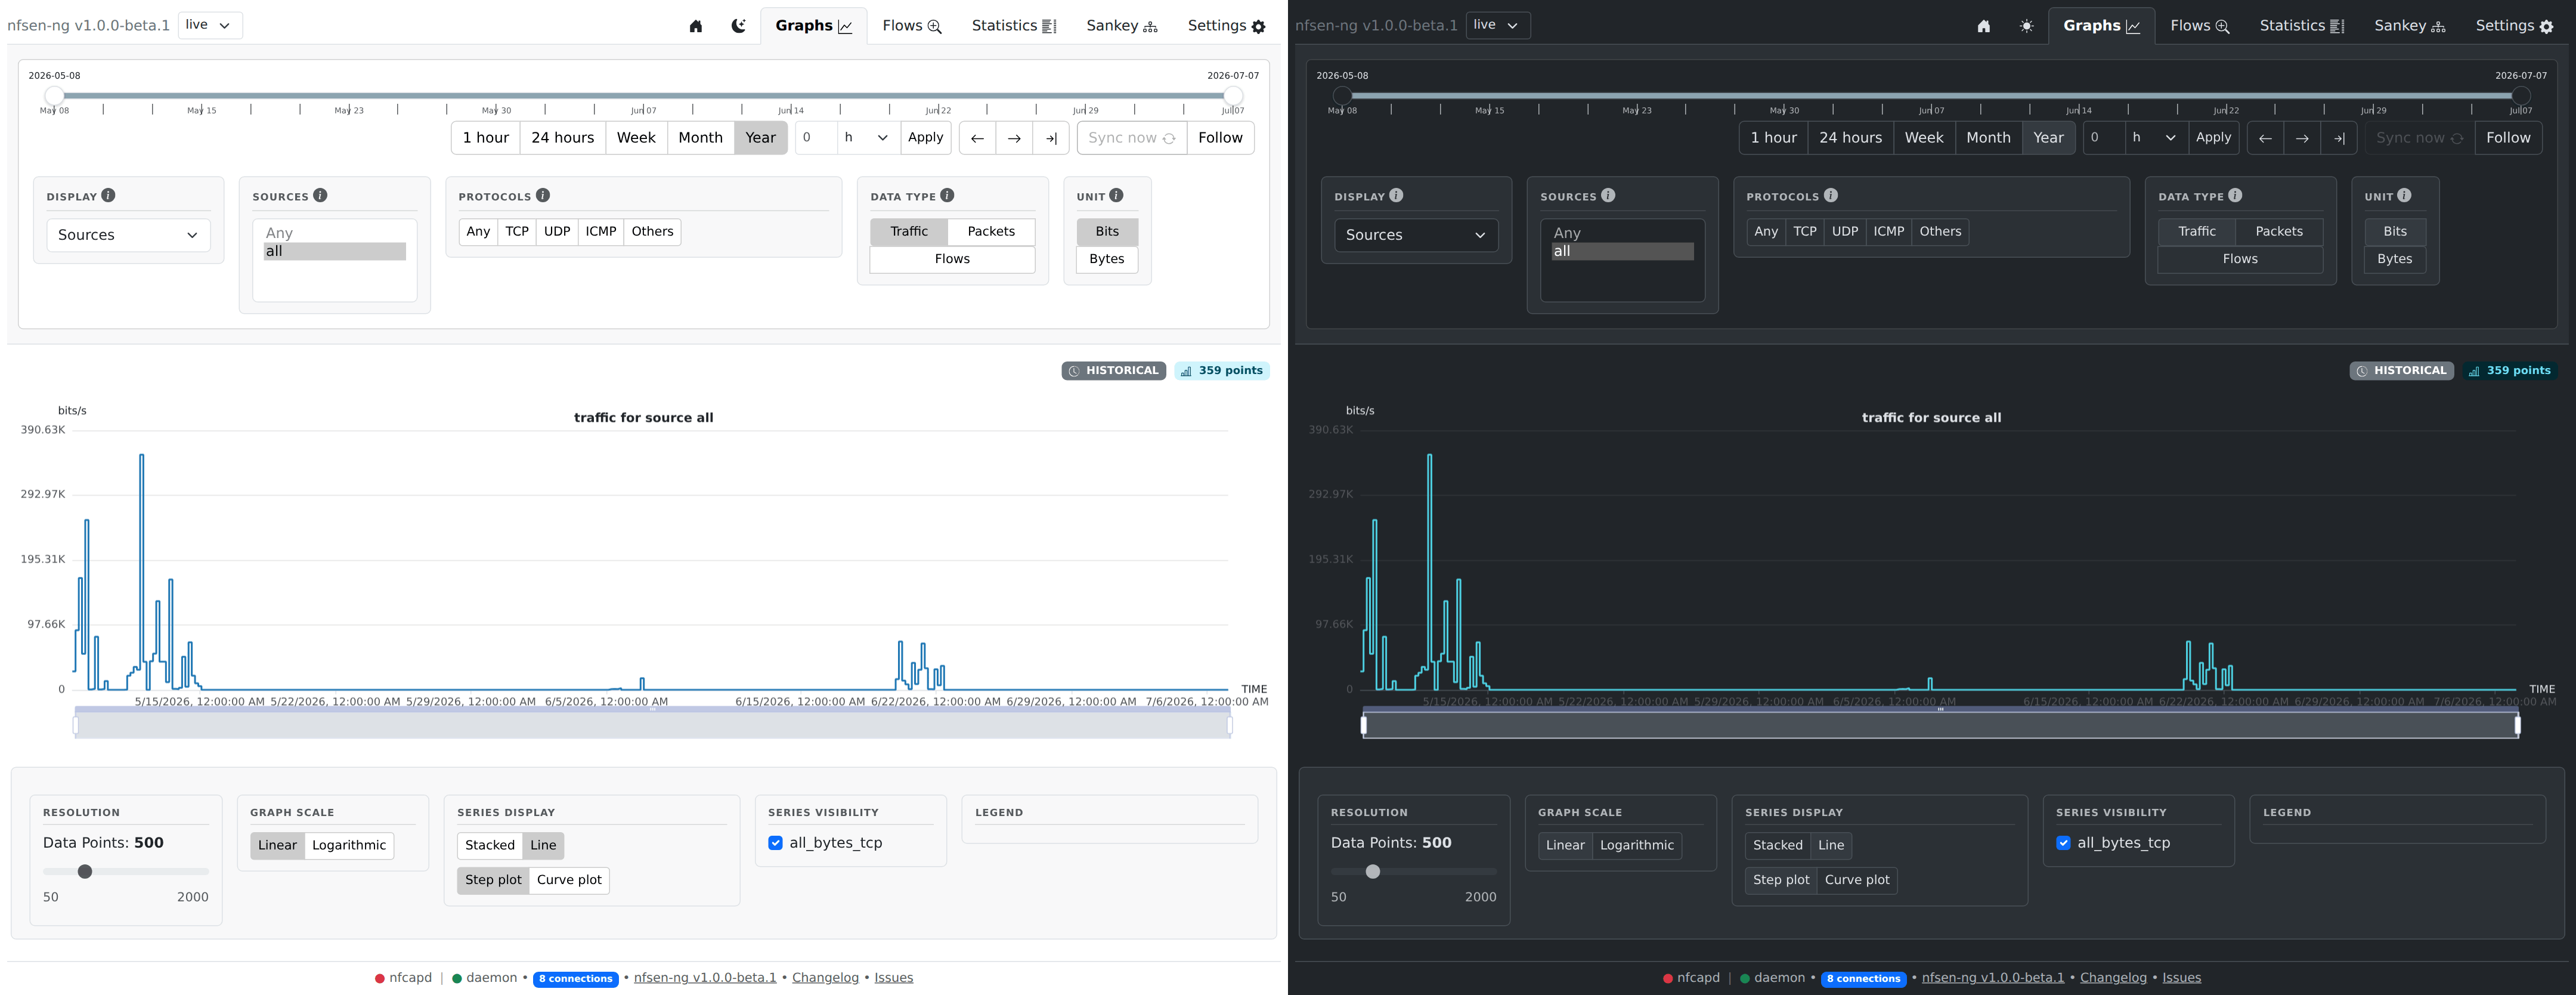
The default landing tab: time-series traffic graphs rendered with Apache ECharts, driven by the shared date-range control (top of every data tab) and a filter panel.
Filters
| Control | Effect |
|---|---|
| Display | Group series by Sources, Protocols, or Ports |
| Sources | Any configured source, all, or a specific subset |
| Protocols | Any / TCP / UDP / ICMP / Others |
| Data type | Traffic / Packets / Flows |
| Unit | Bits or Bytes |
Data comes from Datasource::get_graph_data() — RRD or VictoriaMetrics,
whichever is configured (see Data Sources).
The graph re-renders live: every nfcapd import broadcasts rrd:live to every
open tab (see Import Pipeline), so the
“LIVE last update” badge and the plotted series update without a manual
refresh.
Resolution & display controls
Below the chart: a data-points slider (points to render, trading resolution for render cost), linear/logarithmic scale, stacked/line series display, and step/curve plot style — all client-side ECharts options, no server round-trip.